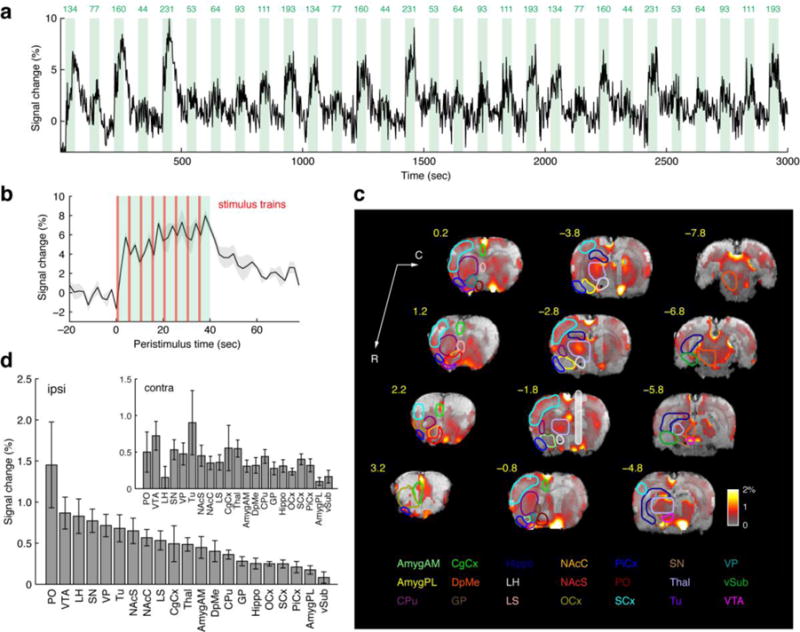
Fig. 1. BOLD fMRI responses to MFB reward stimulation. (a).

Representative blood oxygenation level dependent (BOLD) fMRI response to electrical stimulation of the medial forebrain bundle (MFB), averaged over all voxels in the lateral hypothalamus (LH) ipsilateral to the stimulation electrode in a single rat. Ten stimulation frequencies (green labels, in Hz) were presented in pseudo-random order and the stimulation sequence was repeated three times over the duration of the scan session. Each green rectangle corresponds to one stimulation block. (b) Average LH response to a 40 s block of eight MFB stimulation trains delivered at 231 Hz, showing peaks in the response profile following each 1 s train (vertical red lines). The gray shading indicates standard error of the mean (s.e.m.) over three stimulus presentations in a single animal, at time points with respect to the stimulus onset at t = 0 seconds. (c) Map of average fMRI responses to MFB stimulation over stimulation frequencies from 44–231 Hz in a group of ten animals. Data are displayed as an array of 1 mm slices from rostral to caudal, beginning with the most rostral slice at the lower left (coordinates with respect to bregma displayed to the top left of each slice, in yellow). Background images are T2-weighted anatomical images. Color overlays in red-yellow depict the BOLD amplitude as % signal change, according to the color bar (lower right). Colored outlines depict boundaries of 21 regions of interest (ROIs); only ROIs contralateral to the electrode (white shaded bar, −1.8 from bregma) are drawn. Color-coded ROI labels at bottom correspond to the ROI outlines. Data were thresholded for statistically significant activation with partial Bonferroni correction (p ≤ 0.0001). (d) ROI-averaged mean BOLD signal modulations elicited by 44–231 Hz MFB stimulation, arranged from maximum to minimum amplitude for ROIs ipsilateral to the stimulation electrode. Contralateral response amplitudes are shown in the inset. Error bars denote s.e.m. over animals (n = 10). Signal change calculations included all voxels in each ROI, excepting regions of signal drop out due to implants and areas dominated by macrovascular responses, which were excluded from ROI averages.
