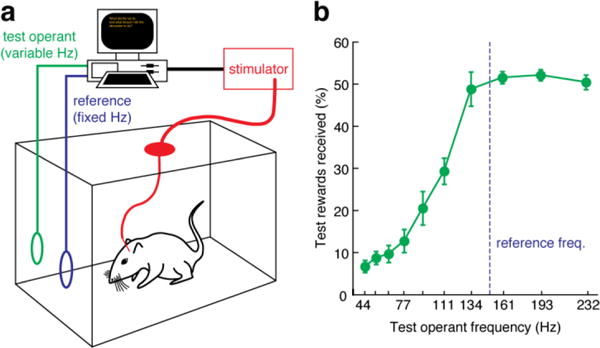
Fig. 2. Reward titration analysis and behavioral results.

(a) Diagram of the apparatus for measuring reward titration curves. Rats implanted with an MFB stimulation electrode and connected to a constant current stimulator (red) were placed into an operant chamber with two nose poke holes. One hole was associated with a stimulation reward delivered at a fixed reference frequency (blue) while the second hole was associated with a test stimulation frequency that varied from trial to trial (green). Timing of the trials and stimuli is automated by custom software running on a computer. (b) The percentage of test operant actions is plotted as a function of test frequency for a range of frequencies, offered in the two-choice test against a reference frequency of 150 Hz. Stimulation frequencies below 134 Hz are increasingly rewarding and are chosen with increasing probability as they approach the reference. Frequencies above 134 Hz are virtually indistinguishable from 150 Hz stimulation, giving rise to the flat response profile at high frequency that characterizes the reward saturation phenomenon. The graph shows mean and s.e.m. for 8 rats.
