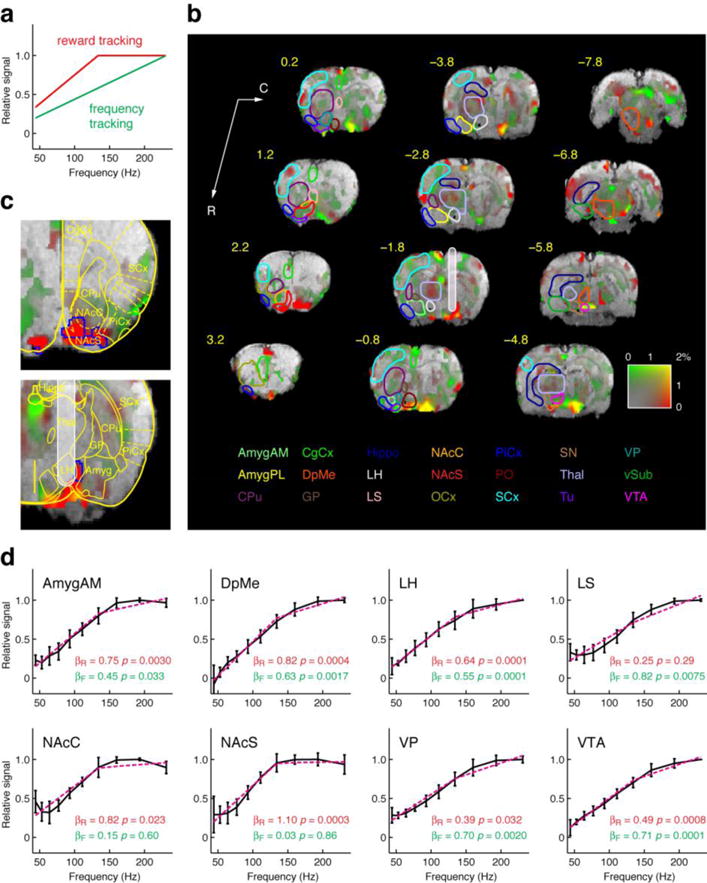
Fig. 3. Brain region-specific tracking of psychometric reward magnitude.

(a) Frequency tracking (green) and reward tracking (red) models used for regression analysis of stimulation frequency-dependent BOLD response amplitudes. The frequency tracking model predicts responses linearly proportional to the stimulation frequency, whereas the reward tracking model idealizes the saturation effect seen in the behavioral reward titration analysis, with an asymptotic saturation frequency equal to the experimentally observed value in Fig. 2b. (b) Voxel-level characterization of frequency vs. reward tracking by BOLD signal amplitudes in a group analysis of 8 rats. Amplitudes as a function of frequency were analyzed using a GLM incorporating frequency and reward tracking regressors from panel A. The amount of fMRI signal change (%) ascribed to frequency and reward tracking models is color coded such that pure frequency tracking appears green, pure reward tracking appears red, and an equal mixture appears yellow (color code shown bottom right). Maps are overlayed on a T2-weighted anatomical scan, and ROIs and labels are shown as in Fig. 1c. (c) Close up of the two most pronounced foci of reward tracking near nucleus accumbens shell (NAcS, top) and adjacent to the amygdala (Amyg) near the stimulation electrode site (bottom). A standard histological map (Paxinos and Watson, 1998) is superimposed over the data. Voxels that showed statistically significantly (t-test p < 0.05) greater reward tracking than frequency tracking are outlined in blue; NAcS contains the largest cluster of significantly reward tracking voxels. (d) Plots of normalized mean BOLD amplitudes vs. stimulation frequency for several ROIs (mean ± s.e.m. shown for each in black, n = 8). Relative contributions of the two models to the BOLD signal from each ROI were expressed as coefficients βR and βF for reward and frequency tracking regressors, respectively. Corresponding p values for F-tests of the significance of each regressor’s contribution are noted. Pink dotted lines indicate the best fit regression curve in each case. Among the ROIs shown, NAcS and NAcC were the only regions that showed significant contribution of the reward tracking model, but not the frequency tracking model. Corresponding βR values indicated that over 80% of the fMRI signal variation could be explained by the reward tracking model in both NAcC and NAcS.
