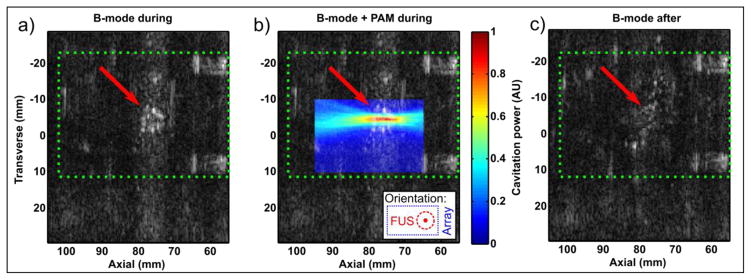
Figure 4.
Monitoring of PSNE vaporization with B-mode and PAM. Green dotted rectangle indicates the outline of the hydrogel, and red arrow the position of the FUS transducer focus. (a) B-mode image taken during sonication showing formation of a bubble cloud (arrow). (b) The same B-mode image with co-registered PAM (passive) image showing cavitation coincident with the bubble cloud. Inset shows orientation with array to right of image and FUS out of page. (c) B-mode image taken after sonication showing dissolution.

