Figure 7.
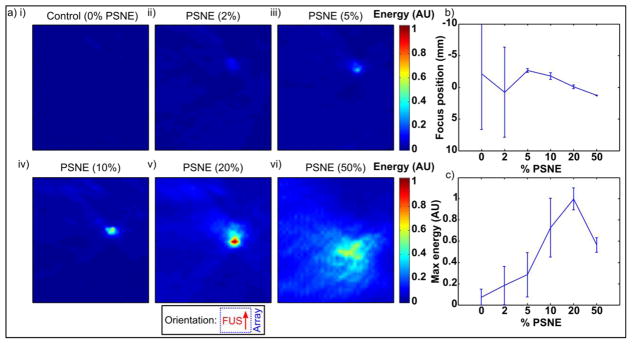
(a) Passive acoustic maps showing spatial localization of cavitation activity as a function of PSNE concentration. Inset shows orientation with array to right of image and FUS propagation from bottom to top. Maps show a region of interest of ±10mm transverse, 80–200mm axial with respect to the imaging array. Maps show the sum of activity over each experiment. The transverse axis is shown on a finer scale to show detail. (b) Transverse peak location (mm) over 3 trials per condition. (c) Peak energy (AU) over 3 trials per condition.

