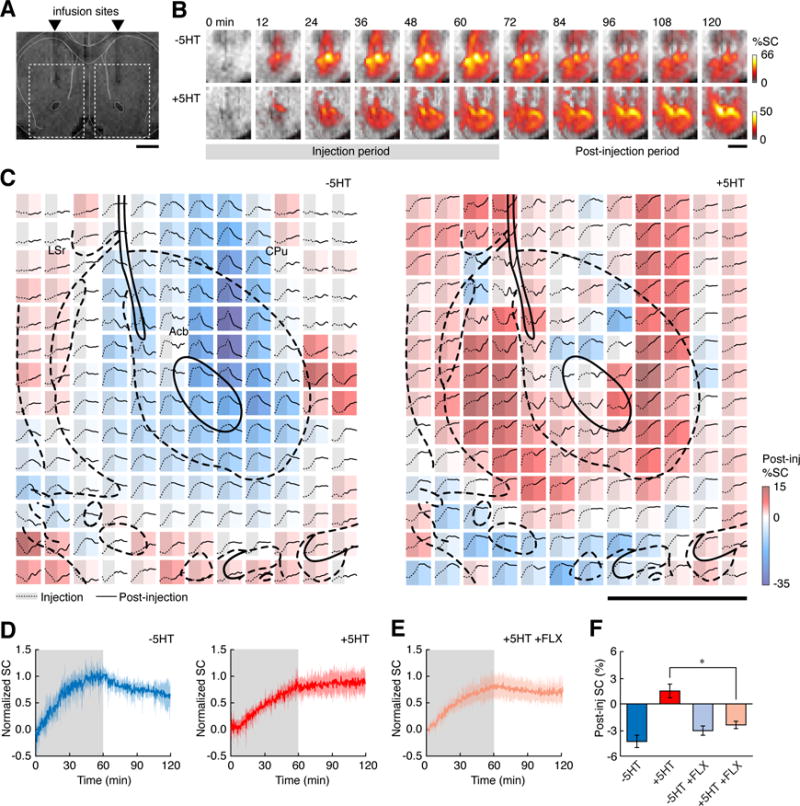
Figure 1.

The MRI sensor 2G9C6 detects serotonin transport in rat brain. (A) 500 μM 2G9C6 is injected with or without equimolar serotonin (5HT) bilaterally into rat striatum, 1.2 mm rostral to bregma. Scale bar = 3 mm. (B) Representative image series obtained during (gray underline) and after injection of 2G9C6 without (top) and with (bottom) 5HT show percent signal change from pre-injection baseline (%SC, color scale) as a function of time (labels at top). Regions of interest (ROIs) shown correspond to dashed rectangles in panel (a), and grayscale underlays are anatomical MRI data. (C) Signal changes observed after injection of 2G9C6-5HT (left) or +5HT (right) in a representative experiment. Each colored square represents a single 200 μm × 200 μm voxel, color coded by the percent change in signal during the 60 minutes following infusion (Post-inj %SC, color bar at right). Each voxel’s time course is inset as a graph showing time points both during (left, gray shading, dotted line) and after injection (right, solid line). The color-coded values indicate systematic differences in the MRI signal dynamics observed following injection of 2G9C6 −5HT vs. +5HT. Scale bar = 1 mm; atlas overlay (thick black lines) indicates local brain regions. (D) ROI-averaged MRI signal changes observed during (shaded regions) and after infusion of 2G9C6 −5HT (left) or +5HT (right). Shading indicates s.e.m. (n = 5 animals). (E) ROI-averaged molecular fMRI time course following injection of 2G9C6 +5HT in animals pretreated with 5 mg/kg fluoxetine (FLX, n = 5). (F) Mean post-infusion signal changes observed following injection of 2G9C6 −5HT and +5HT in animals with or without FLX pretreatment.
