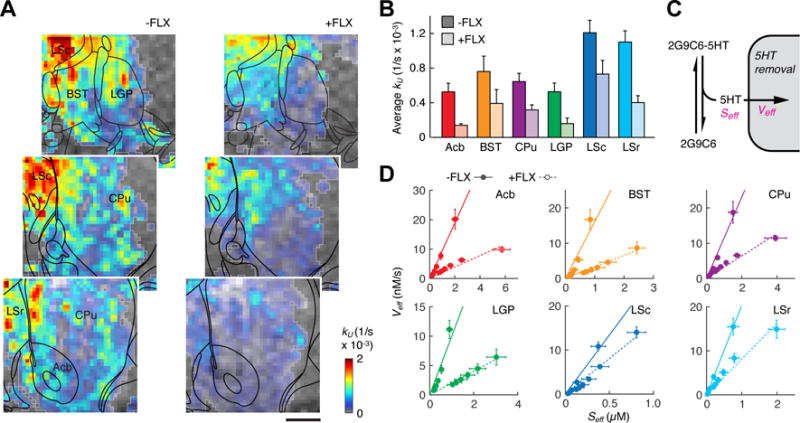
Figure 4.

5HT transport parameters obtained from compartmental modeling. (A) Maps of 5HT unbinding rates (color-coded kU values, color scale bottom right) observed in the absence (left) and presence (right) of FLX pretreatment. Anatomical MRI data is shown as a grayscale underlay, and voxels included in the kinetic analysis are outlined in light gray (all n ≥ 2 animals). Coordinates with respect to bregma indicated in white, atlas overlays in black, and scale bar = 1 mm. (B) Average kU values observed in six anatomical ROIs in the absence (dark colors) or presence (light colors) of FLX pretreatment. All differences except BST were significant with p < 0.049. (C) Schematic illustrating definition of Seff as the estimated 5HT concentration arising from fast equilibrium between 2G9C6-5HT and 2G9C6, and definition of Veff as the total rate of 5HT removal from its equilibrium with 2G9C6. (D) Graphs of average Seff vs. Veff for six post-infusion time points in each ROI, both with (solid circles) and without (open circles, dashed lines) FLX pretreatment. Linearity of the plots suggests non-saturating 5HT removal in each region, while differences in the slopes suggest variable effects of FLX consistent with the images in panel (A).
