
Figure 5.
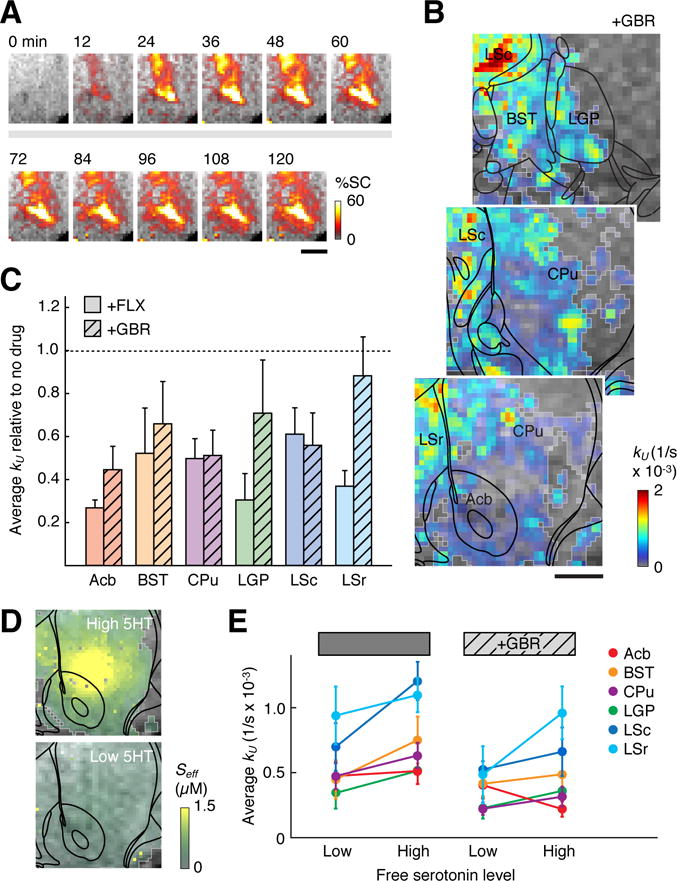
Perturbation of 5HT transport by inhibition of dopamine transporters. (A) Time series images similar to Figure 1B, showing sustained MRI signal increases following brain infusion of 2G9C6-5HT in the presence of the DAT blocker GBR. (B) A map of 5HT unbinding rates observed after GBR pretreatment, color coded and labeled as in Figure 4A. Scale bar = 1 mm. (C) Graph showing mean values of the 5HT removal rate constant kU observed for six ROIs in the presence of FLX or GBR, both shown relative to values observed in the absence of drug treatment. (D) Effective free 5HT concentrations (Seff) following infusion of 1:1 5HT:2G9C6 (top, high 5HT) or 1:2 5HT:2G9C6 (bottom, low 5HT) into rat brain, as estimated from compartmental model fitting. Scale bar = 1 mm. (E) Mean 5HT unbinding rates (kU values) for six ROIs, determined by compartmental modeling of data obtained in the low and high 5HT regimes of panel D, in the presence and absence of DAT inhibition with GBR. Suppression of kU by GBR in CPu is significant under both high and low 5HT regimes (p = 0.03–0.05), while suppression of kU in Acb and LSc is significant only at high 5HT (p = 0.05).