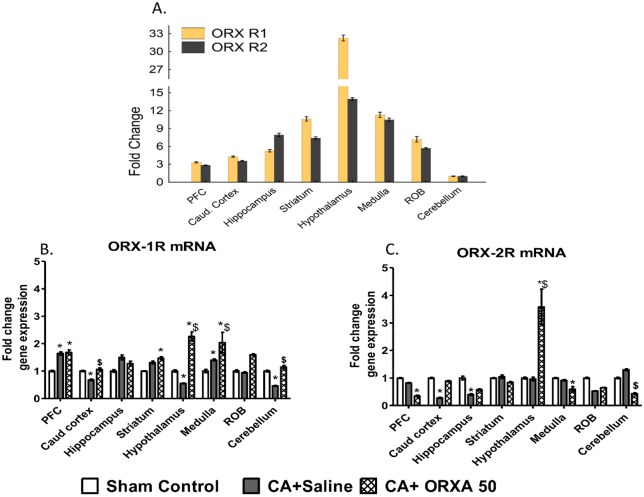
Fig 4. Effects of CA and ORXA treatment (50 μM) on mRNA levels of ORX receptors in different brain structures.
(A) mRNA levels of Orexin receptor 1 and 2 in different brain structures as compared to Cerebellum. (B-C) Effects of CA and ORXA treatment on mRNA levels of ORX receptor-1 (B), and ORX receptor-2 (C). Results are expressed relative to the control group. Asterisks and pound sings indicate significant differences from Sham control or CA+Saline group, respectively, as a result of LSD post-hoc tests with p levels corrected for multiple comparisons, pcor<0.0021 (see S5 Table for results of ANOVA). Probe sequences for RT-PCR are presented in S2 Table.

