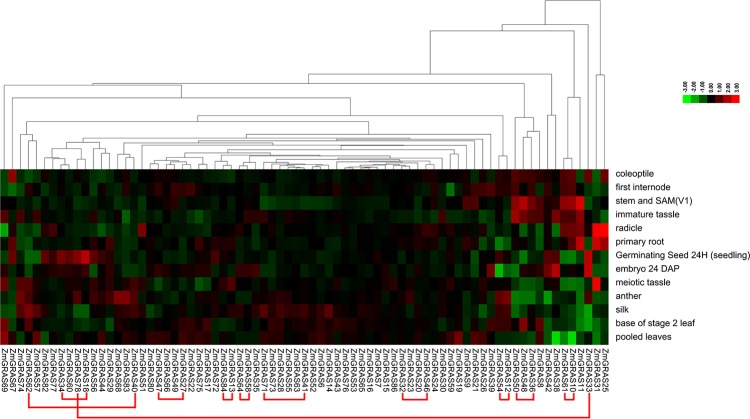
Fig 4. The expression of GRAS gene family members in different tissues of maize.
In the heat map, columns represent genes, while rows represent different tissues, including germinating seed 24 H (seedling), coleoptile, radicle, stem and SAM (V1), first internode, immature tassel, meiotic tassel, anthers, primary root, pooled leaves, silks, base of stage 2 leaf (adult leaf), and embryo 24 DAP. The color changes from green to red represent the relative low or high expression in leaves respectively. The red lines represent eleven duplicated genes pairs.

