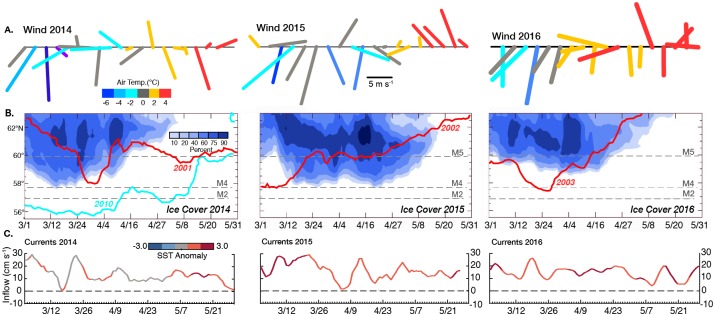
Fig 4. Winds, currents and sea ice.
Panels (A)–(C) are March–May time series from 2014 (left), 2015 (middle), and 2016 (right). (A) 5-day average winds at 57.32°N, 166.32°W. Vectors are color-coded according to air temperature. (B) Time series of contours of daily areal ice concentration for 0.25° latitude bands in the light-shaded area in Fig 1. The latitudes of the two long-term moorings on the southern Bering Sea shelf are indicated with dashed lines, as is M5 in the transition zone between the southern and northern shelf. Daily maximum ice extent is indicated for 2010 (blue) and 2001, 2002, and 2003 (red). (C) Daily mean derived currents through Unimak Pass. Lines are color-coded by SST anomaly upstream near the Shumagin Islands (star in Fig 1, 54.625°N, 161.125°W). Positive indicates inflow into the Bering Sea.

