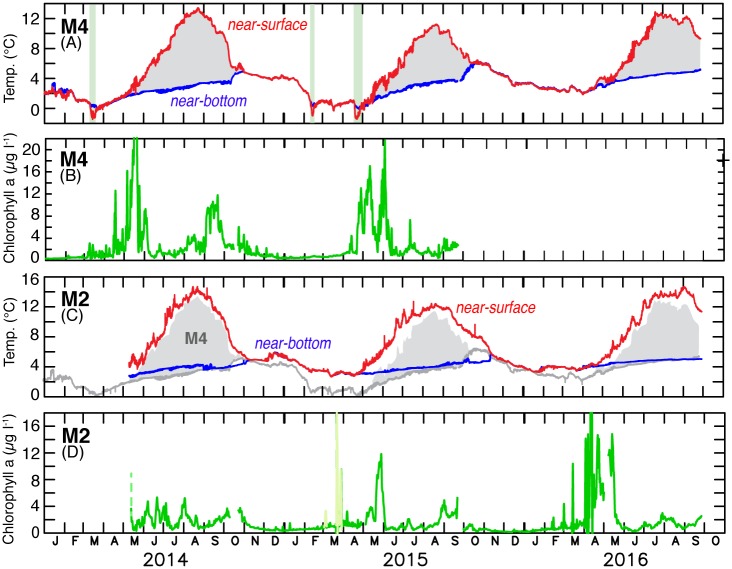
Fig 5. Moored biophysical measurements.
The time series in 2014–2016 of near-surface and near-bottom temperature at (A) M4 and (C) M2, and chlorophyll fluorescence at ~11 m at (B) M4 and (D) M2. All data have been low-pass filtered with a 35-hour Lancsoz filter. The pale green stripes in (A) indicate the presence of sea ice (>15% ice cover). Note that (A) and (C) have the same aspect ratio, but the scale is shifted by 2°C, and that (B) and (D) have different scales. The gray in (C) indicates the range of temperature at M4 and is to ease comparison between M2 and M4. Fluorescence, indicated by pale green in (D), was a short period of extremely high variability.

