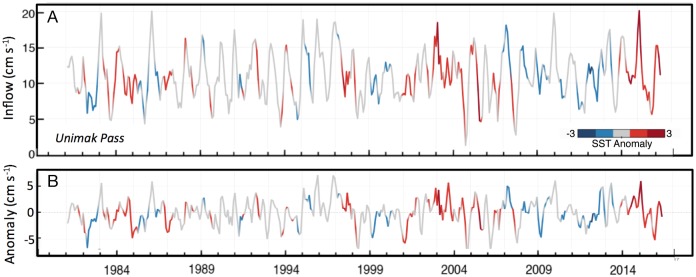
Fig 9. Flow through Unimak Pass.
(top panel) Monthly mean derived current through Unimak Pass (Eq 1). The line is color-coded to indicate the SST anomaly upstream near the Shumagin Islands (star in Fig 1, 54.625°N, 161.125°W). Positive indicates inflow into the Bering Sea. (bottom panel) The monthly mean anomaly for flow through Unimak Pass.

