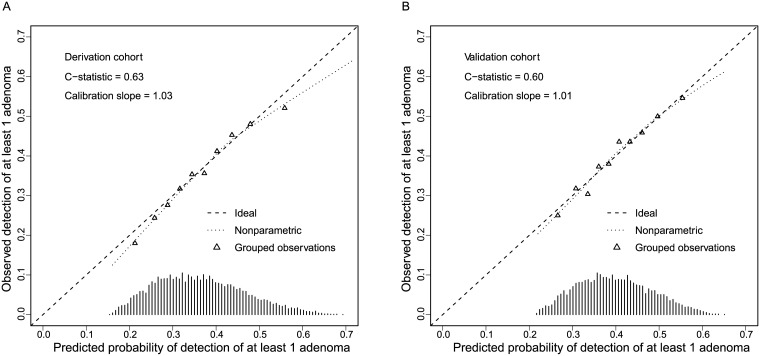
Fig 2. Calibration plot of the model performance A) within the derivation cohort after internal validation (figure at the left), and B) within the validation cohort after logistic re-calibration (figure at the right).
Grouped observations are grouped per decile of patients. The observed proportion of patients with ≥1 adenoma detected is displayed on the y-axis, and the predicted proportion of patients with ≥1 adenoma on the x-axis. C-statistic, concordance statistic.

