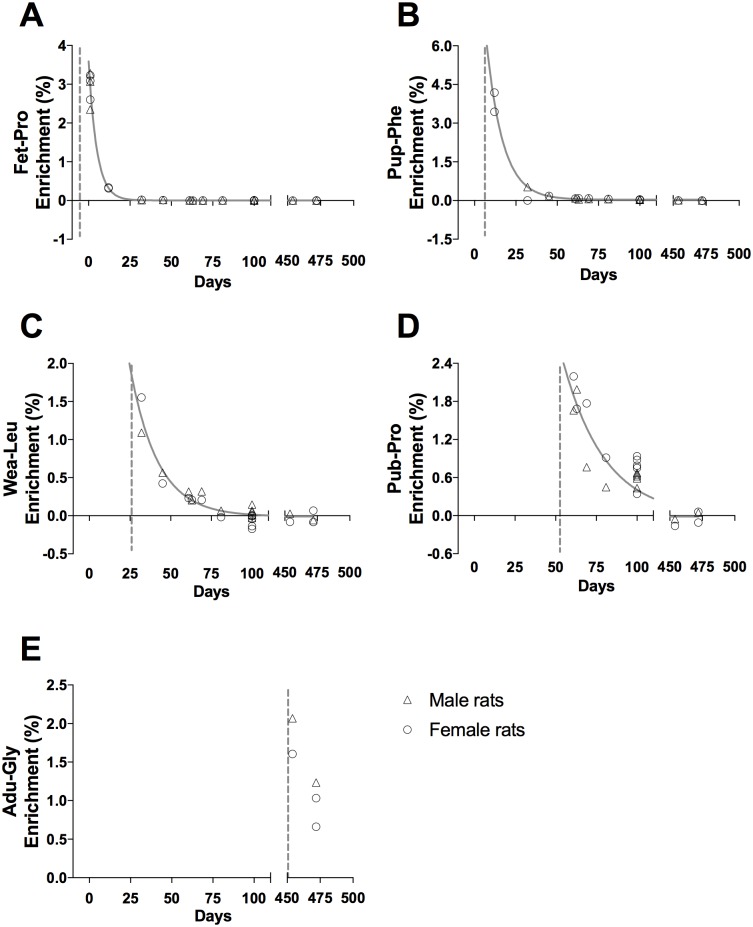
Fig 5. Tracer enrichment in muscle cytoskeletal/contractile proteins, CYTO.
(A) Fet-Pro, (B) Pup-Phe, (C) Wea-Leu, (D) Pub-Pro, (E) Adu-Gly. Male (triangle) and female rat (circle) values are represented as individual enrichment values (%) in the muscle CYTO. The dashed vertical line indicates the start of the injection period of the tracer. An exponential decay regression curve is marked by a grey line in A—D (t1/2: (A) 3.5 days, (B) 6.9 days, (C) 11.8 days and (D) 17.9 days).

