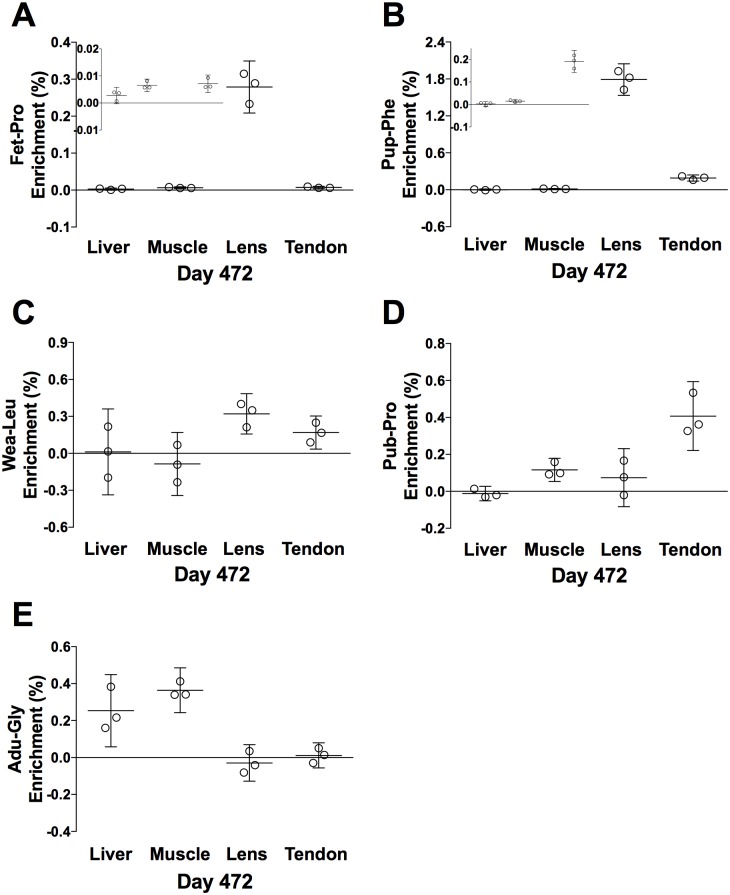
Fig 12. Day 472 tracer enrichment in connective tissue proteins, CT.
(A) Fet-Pro, (B) Pup-Phe, (C) Wea-Leu, (D) Pub-Pro, (E) Adu-Gly. Values are represented as individual enrichments (%), mean ± 95% CI analyzed in the liver, muscle, eye lens and patellar tendon CT, n = 3. Fig. 12A and 12B includes inserts showing the distribution of the enrichment at baseline. The orders of the tissues are the same as the large panels.

