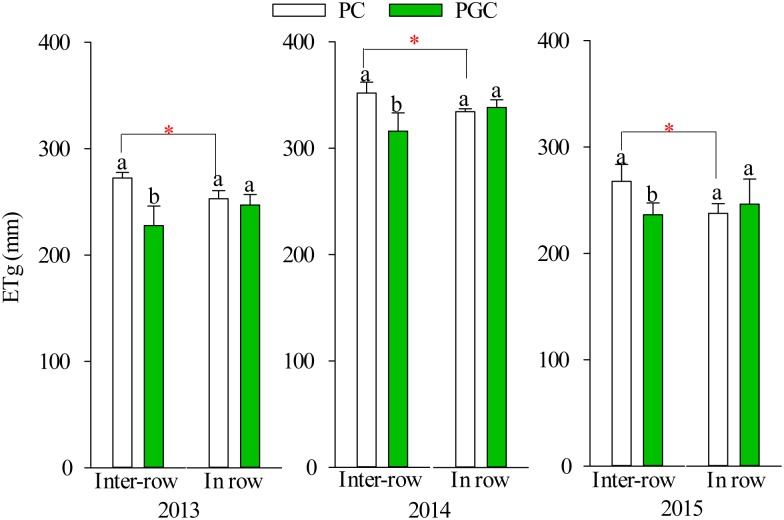
Fig 6. The evapotranspiration during the grass cover period (July-September) in 2013, 2014 and 2015.
Lowercase letters denote significant differences between PC and PGC for the inter-row or in-row (p ≤ 0.05). “*” indicates that the differences between the inter-row and in-row (connected by lines) of the PC or PGC treatment were significant (p ≤ 0.05). Error bars were the standard deviations.

