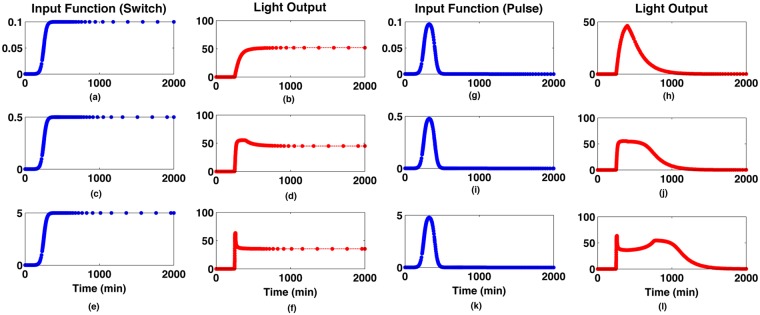
Fig 3. Relationship between promoter activity and light output.
Nonlinear relationship between promoter activity and light output for a synthetic pulse or switch of gene expression at different levels. The bioluminescence displays different qualitative and quantitative behaviours from the underlying gene expression. With the switch data, the bioluminescence has slower onset compared with gene expression, and, for high levels of gene expression, shows a transient pulse not present in the gene expression. With the pulse data, the bioluminescence shows much longer persistence than the underlying gene expression. These data show that bioluminescence alone could be a misleading measure of gene expression.

