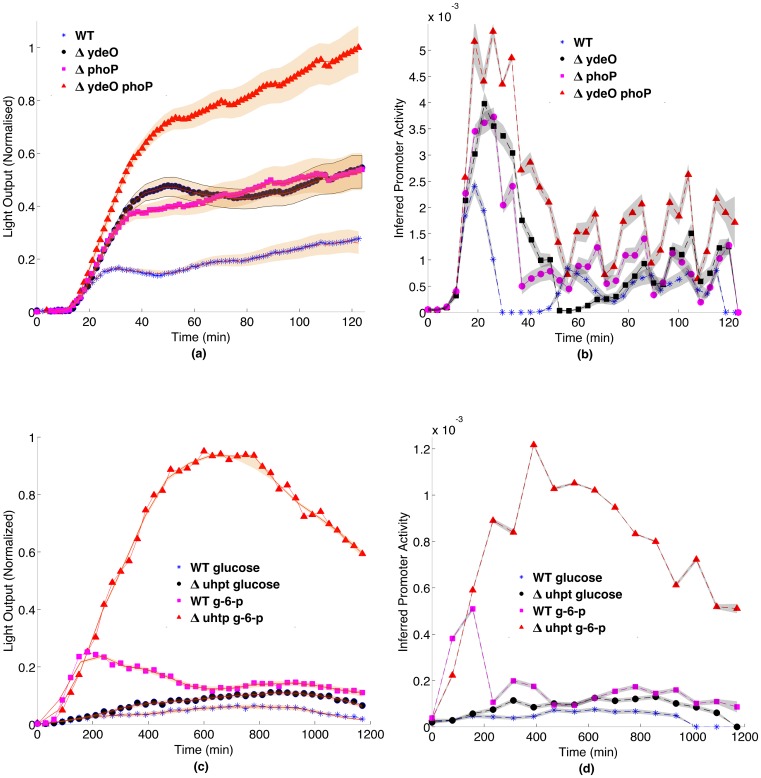
Fig 5. Reverse engineering of promoter activity from experimental data.
(a) Bioluminescent data and (b) reverse engineered gene expression from the safA-ydeO promoter in E. coli. The pattern of gene expression is very different from the light output pattern. In particular, the increased bioluminescence is partly explained by greater duration of gene expression not just level of gene expression; gene expression in the WT and yodel mutant appears to be switched off after induction, which is not apparent in the bioluminescence; and the inferred expression shows pulses which are an artefact of the experimental arrangement, in which plates were moved every 15 minutes between a spectrophotometer and a luminometer, demonstrating that the agitation has an impact upon the cells. The shaded areas in the graphs represent 50 simulations resampling from the posterior distribution.(c) Bioluminescent data and (d) reverse engineered gene expression from data from the uhpT promoter in S. aureus showing that the peak of gene expression occurs earlier than the light output, and that the duration of gene expression is shorter than would appear from the light output.

