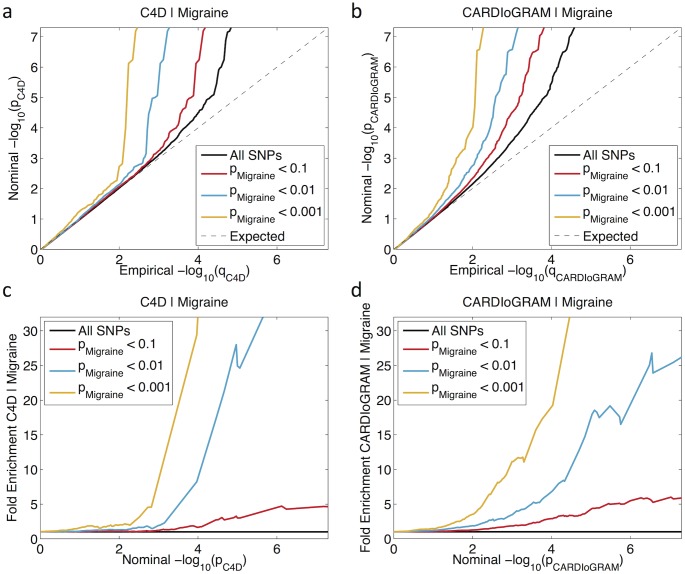
Fig 2. Genetic cross-phenotype enrichment of CAD conditional on migraine.
(a-b) Conditional Q-Q plot of nominal versus empirical -log10 P-values (corrected for inflation) in CAD as a function of significance of association with migraine at the level of P ≤ 1, P < 0.1, P < 0.01 and P < 0.001. Dotted lines indicate the null-hypothesis. (c-d) Plots showing fold enrichment for association to CAD in a given -log10 P-value bin as a function of association with migraine.

