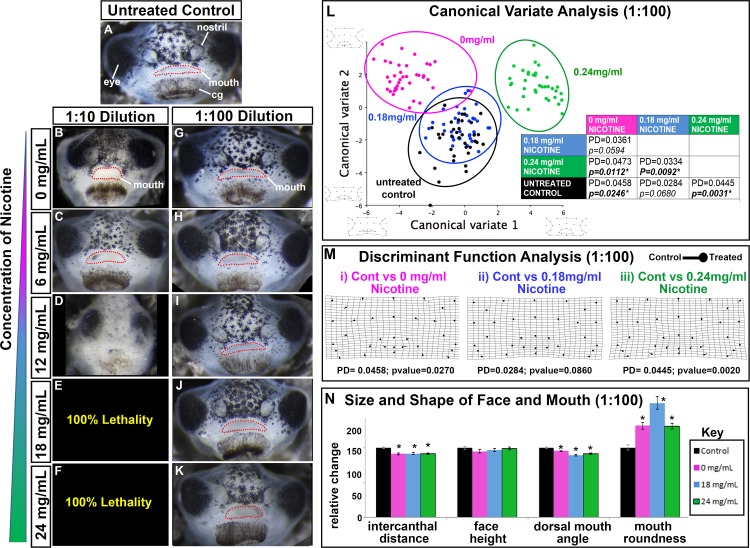
Fig 2. Effect of Lab Grade e-cigAMs on X. laevis orofacial development.
(A-K) Representative frontal views of (A) untreated control, (B-F) 1:10, or (G-K) 1:100 dilutions of lab grade e-cigAMs containing (B,G) 0 mg/ml, (C,H) 6 mg/ml, (D,I’) 12 mg/ml, (E,J) 18 mg/ml, or (F,K) 24 mg/ml concentration of nicotine. Mouth outlined in red dots. (L) Canonical variateanalysis of controls and 1:100 dilution of Lab Grade e-cigAMs. Black = untreated controls, pink = Lab Grade e-cigAM with 0 mg/ml nicotine, blue = Lab Grade e-cigAM with 18 mg/ml nicotine, green = Lab Grade e-cigAM with 24 mg/ml. Table includes Procrustes distances (PD) and p-values. Significant p-values in bold with asterisks. Wireframe graphs represent shape changes associated with position on graph. Canonical variate 1 = 66.0% variance, Canonical variate 2 = 21.5% variance. (M) Discriminant function analysis of controls compared to Lab Grade e-cigAM with (i) 0 mg/ml, (ii)18 mg/ml, or (iii) 24 mg/ml concentration of nicotine. Flat end of vector is average landmark position of controls, round end is average landmark position of Lab Grade e-cigAMs. Procrustes distances (PD) and p-values below graphs. (N) Measurements of intercanthal distance, face height, dorsal mouth angle, and mouth roundness of controls (black), and 1:100 dilutions of e-cigAMs containing 0 mg/ml (pink), 18 mg/ml (blue), or 24 mg/ml (green) concentration of nicotine. Controls were set to 100 and exposure groups normalized to it. Student’s t-test assuming unequal variance was performed on non-normalized data. Error bars represent standard error. Asterisks indicate significant difference when compared to controls. Alpha value for all statistical analyses = 0.02. cg = cement gland.

