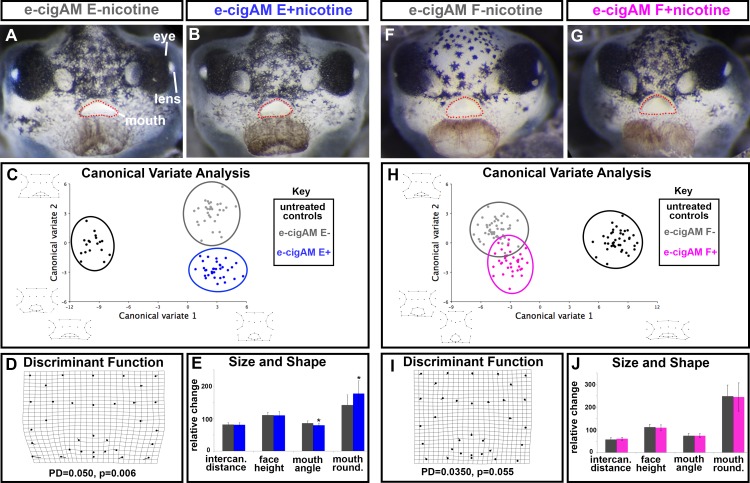
Fig 4. Effect of flavored e-cigAMs with and without nicotine on X. laevis orofacial development.
(A,B) Representative frontal views of embryos exposed to (A) e-cigAM E- containing 0 mg/mL of nicotine or (B) e-cigAM E+ containing 18 mg/mL of nicotine. Mouth outlined in red dots. (C) Canonical variate analysis of controls (black), e-cig-AM E- (grey), and e-cigAM E+ (blue). Wireframe graphs represent shape changes associated with position on graph. Canonical variate 1 = 94.6% variance, Canonical variate 2 = 5.4% variance. (D) Discriminant Function analysis of e-cigAM E- compared to e-cigAM E+. Procrustes distances (PD) and p-values below graph. (E) Measurements of intercanthal distance, face height, mouth angle, and mouth roundness in e-cig-AM E- (grey), and e-cigAM E+ (blue). (F,G) Representative frontal views of embryos exposed to (F) e-cigAM F- containing 0 mg/mL nicotine or (G) e-cigAM F+ containing 6 mg/mL nicotine. (H) Canonical variate analysis of controls (black), e-cig-AM F- (grey), and e-cigAM F+ (pink). Wireframe graphs represent shape changes associated with position on graph. Canonical variate 1 = 79.8% variance, Canonical variate 2 = 20.2% variance. (I) Discriminant Function analysis of e-cigAM F- compared to e-cigAM F+. (J) Measurements of intercanthal distance, face height, mouth angle, and mouth roundness in e-cig-AM F- (grey), and e-cigAM F+ (pink). For bar graphs of size and shape measurements, controls were set to 100 and exposure groups normalized to it. Student’s t-test assuming unequal variance was performed on non-normalized data. Asterisks indicate significant difference when compared to controls. Alpha value = 0.02.

