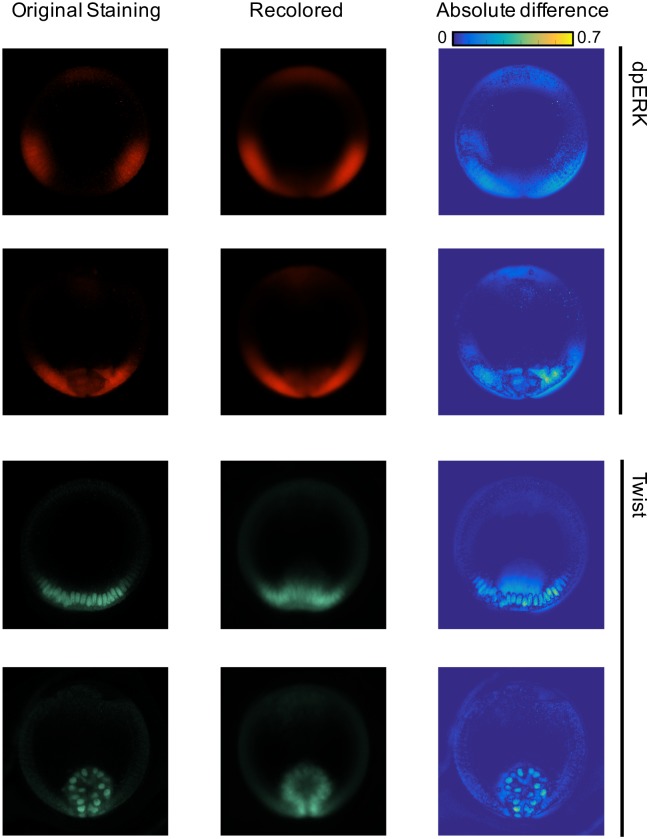
Fig 5. Examples showing how the algorithm performs on four fixed samples.
The first column shows the original measurement, the second column shows the result of recoloring the snapshot through K-fold cross validation, and the third column shows the absolute difference between the original and recolored images, normalized by the signal range.

