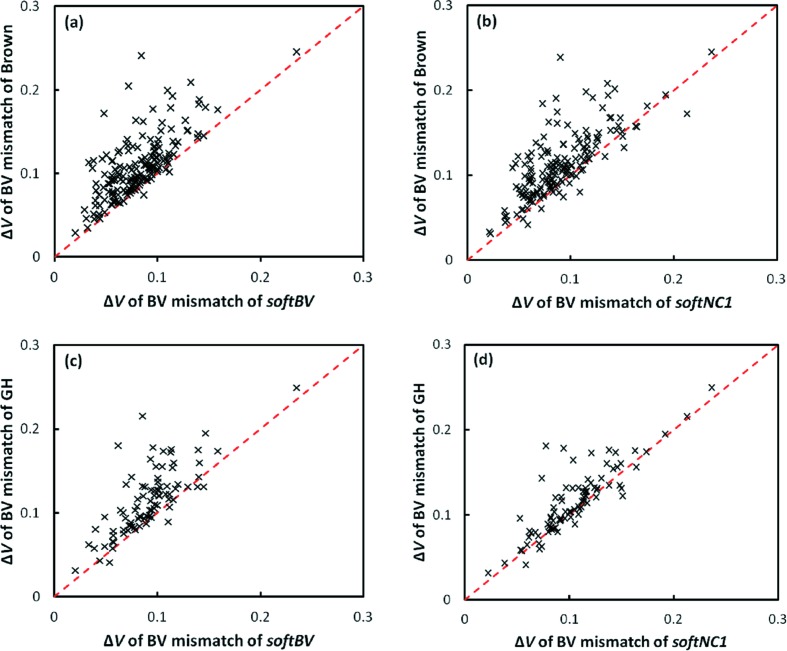
Figure 9.
Comparison of standard deviations when using parameters from Brown’s compilation (top row) or Gagné & Hawthorne’s parameters (bottom row) with softBV (left-hand side) or softNC1 (right-hand side) parameters determined in this work. The comparison involves only those cation–anion pairs with n ≥ 20 cation environments. The softBV parameter set is calculated at the higher cut-off distance suggested for this parameter set, while for the other three sets the cut-off is set to the value of R 1 determined in this work as the limit of the respective first coordination shell.

