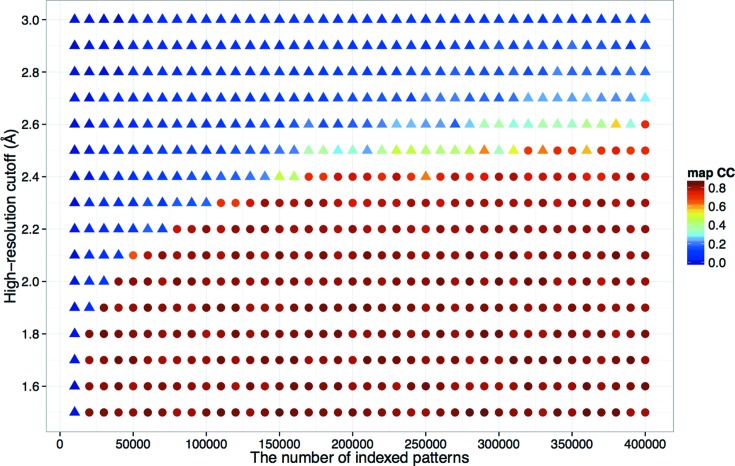
Figure 5.
Effect of the high-resolution cutoff and number of patterns in the case of LRE-Hg. The real-space CC of the model built by Buccaneer and the final refined 2mF
o − DF
c map are indicated by colors, which were calculated using phenix.get_cc_mtz_pdb (Adams et al., 2010 ▸). Success (CC  0.65) and failure of phasing are represented as circular and triangular symbols, respectively. This figure was prepared using ggplot2 (Wickham, 2009 ▸) in R (R Development Core Team, 2008 ▸).

