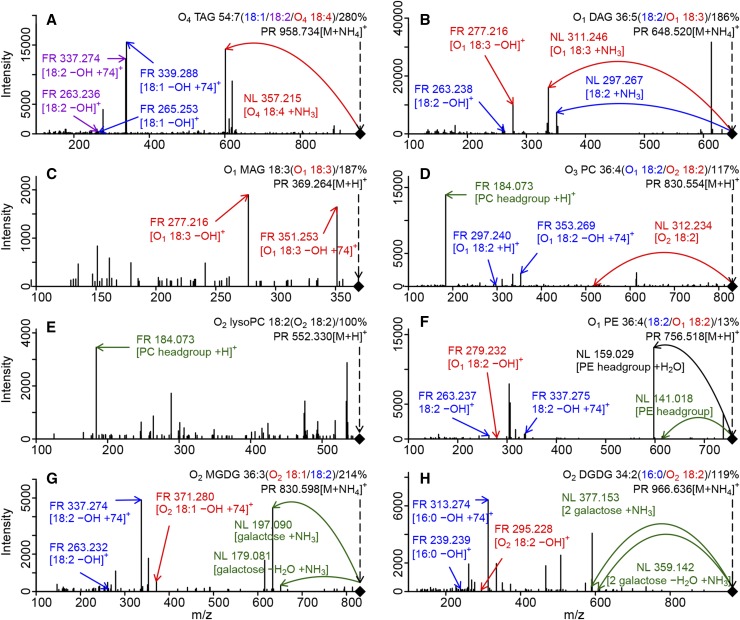
Figure 2.
Examples of MS/MS validation and acyl composition determination for lipids of eight different classes. NLs and fragments (FR) of FAs and head groups were computationally identified and used to validate the PR annotation for O4 TAG 54:7 (Supplemental Table S1, Formula_ID = 9409; for the chromatographic profile, see Fig. 1D [A]), O1 DAG 36:5 (Formula_ID = 7380 [B]), O1 MAG 18:3 (Formula_ID = 1302 [C]), O3 PC 36:4 (Formula_ID = 2322 [D]), O2 lysoPC 18:2 (Formula_ID = 1850 [E]), O1 PE 36:4 (Formula_ID = 1440 [F]), O2 MGDG 36:3 (Formula_ID = 8269 [G]), and O2 DGDG 34:2 (Formula_ID = 8128 [H]). Only subsets of the indicated fragments are depicted. Multiple occurrences of the same FA within the different spectra are indicated by identical colors. FAs are labeled in purple, blue, or red, and head groups are labeled in green. Annotations in black were not obtained computationally and are only used to provide additional information in the example spectra. Representation of the acyl combination in the MS/MS spectra is expressed as cumulative abundance of all explanatory fragments/NLs in percentage of the base peak.

