Figure 4.
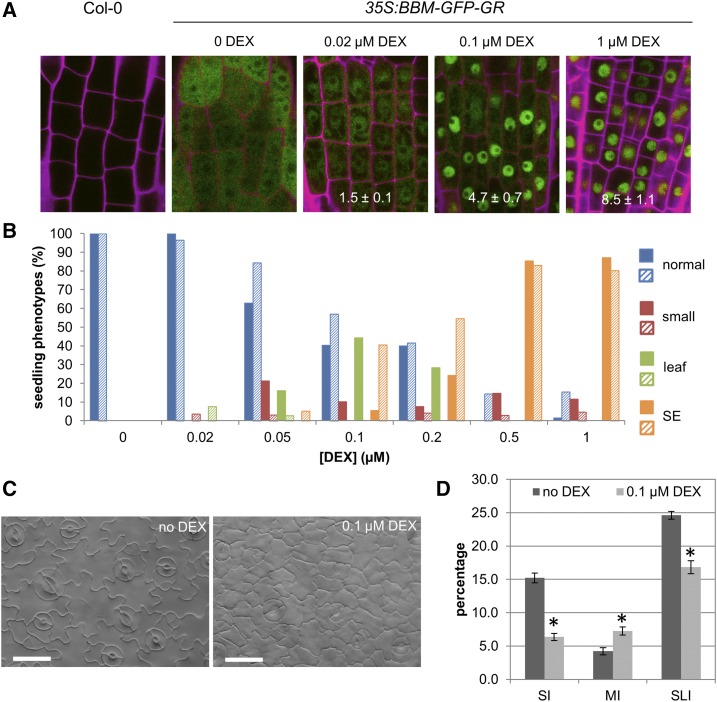
Quantification of BBM dose-dependent phenotypes. A, BBM-GFP-GR nuclear localization increases with increasing DEX concentration. The effect of DEX on BBM localization in roots of 35S:BBM-GFP-GR seedlings grown for 7 d in medium containing the indicated DEX concentration is shown. Non-DEX-treated (Col-0) roots are shown as a GFP-negative control. Subcellular BBM-GFP-GR localization was quantified for each DEX concentration by calculating the average nuclear-cytoplasmic GFP ratio (63–133 cells of five to eight roots per DEX concentration), which is indicated on the bottom of the images (±se). The average ratios are significantly different from each other (P < 0.01, Student’s t test). Green, GFP; magenta, propidium iodide. B, Frequency of phenotypes observed in 35S:BBM-GR seedlings from two independent transgenic lines (solid and hatched bars) grown for 2 weeks on medium containing different DEX concentrations (n = 100–350 seedlings). Leaf, Ectopic leaves; SE, somatic embryos. Seedlings that showed both ectopic shoots and somatic embryos were scored as SE. SE refers to both embryogenic tissue (smooth, swollen, bright green in color, and lacking trichomes) and cotyledons as well as histodifferentiated embryos. C, A relatively low BBM dose induces smaller and less-lobed leaf pavement cells compared with the control. The abaxial sides of cleared first leaves of 9-d-old 35:BBM-GR seedlings grown on medium without DEX (left) or with 0.1 μm DEX (right) are shown. Bars = 25 μm. D, Stomatal differentiation in DEX-treated 35:BBM-GR seedlings is reduced compared with untreated seedlings. In DEX-treated 35S::BBM-GR seedlings, fewer cells are committed to stomatal development, as reflected by the lower stomatal lineage index (SLI). Also, fewer mature stomata were found in leaves of DEX-treated seedlings (stomatal index [SI]), while the number of stomatal meristemoids was increased (meristemoid index [MI]). Error bars indicate se. Asterisks indicate statistically significant differences compared with the non-DEX-treated control (*, P < 0.05, Student’s t test).

