Figure 1.
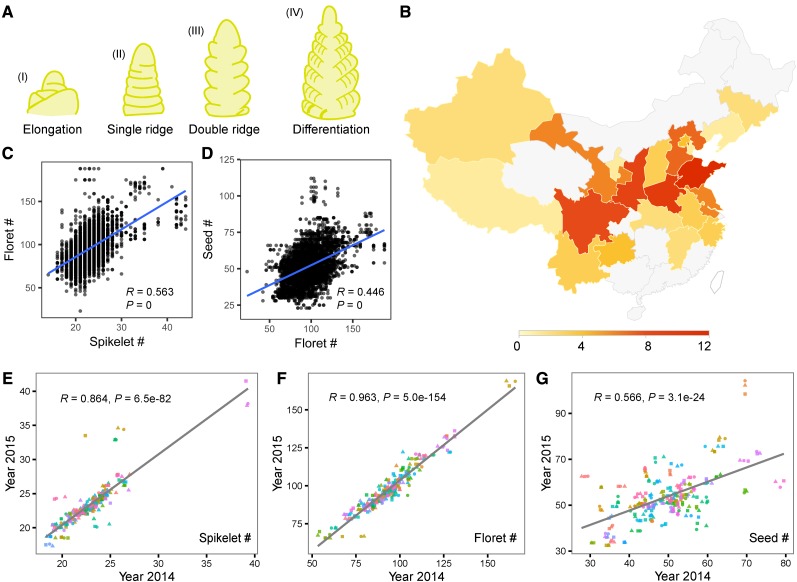
Spike complexity of 90 selected varieties from the Chinese mini core collection. A, Schematic diagram of main spike development in wheat. See Supplemental Figure S1 for scanning election micrographs. B, Geographical distribution of 90 selected winter wheat varieties in China. C, Scatter plot of spikelet number per spike against floret number per spike. D, Scatter plot of floret number per spike against seed number per spike. E to G, Scatter plot of average spikelet (B), floret (C), and seed (D) number per main spike from 2014 against the corresponding values from 2015. Each color denotes one variety, and the shape denotes the replicate. The gray line represents the regression trend calculated by the general linear model of each trait.

