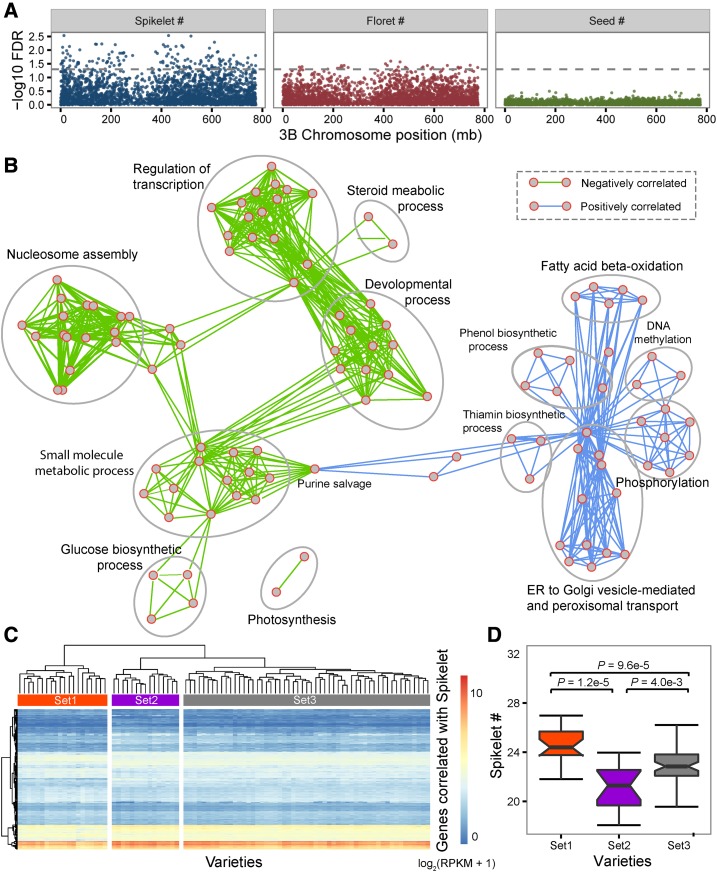
Figure 3.
Transcriptome association analysis for spike complexity. A, Manhattan plot of the association significance between spike traits and gene expression abundance along chromosome 3B. The gray line shows the genome-wide significance level (FDR ≤ 0.05). B, Function enrichment network for GESs significantly associated with spikelet quantity (FDR ≤ 0.05). Enriched GO terms for negatively correlated genes are represented by nodes with green edges, and terms for positively correlated genes are represented by nodes with blue edges. C, The 1,538 GESs can be grouped into three distinct sets based on expression abundance. D, Box plot of the spikelet numbers of the three sets of wheat varieties.

