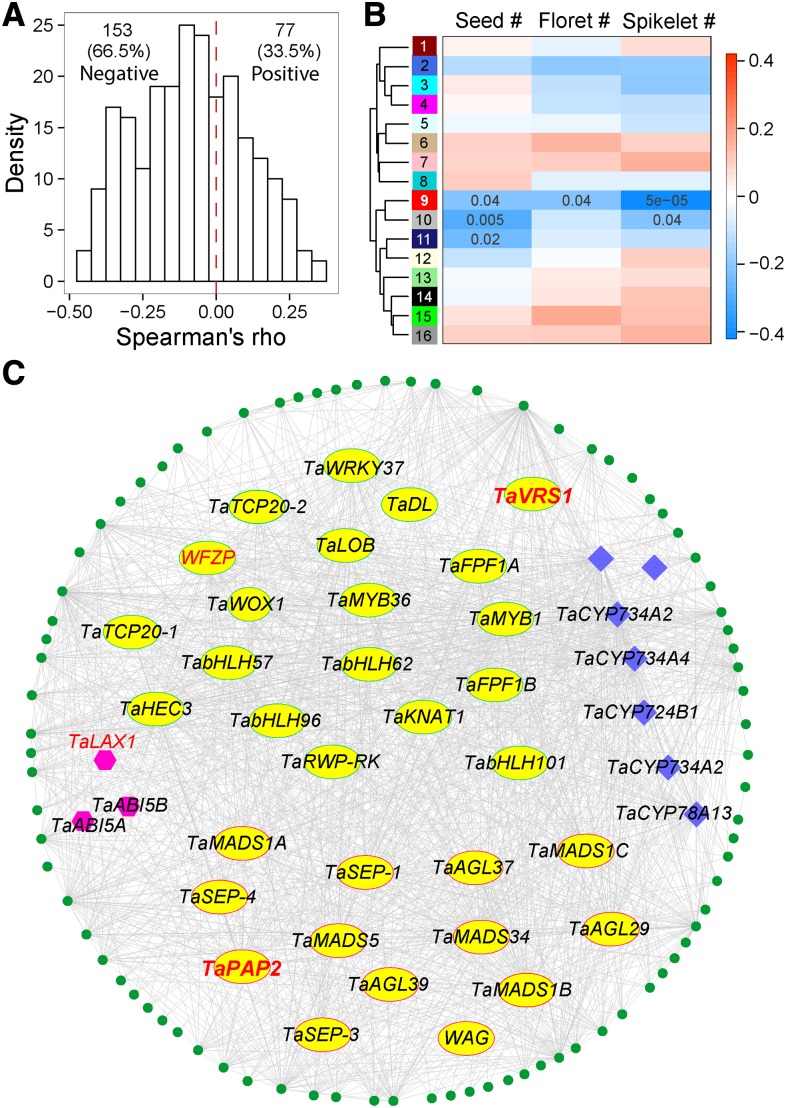
Figure 4.
Coexpression network analysis of GESs associated with spikelet number. A, Distribution of Spearman’s correlations for wheat genes homologous to rice genes previously reported as related to grain traits. B, Correlation heat map between subnetwork modules and spike traits. An eigen value of each module was computed by the WGCNA package to assess correlations between overall expression trends and spike traits. The color bar represents the scale of the Spearman’s correlation. C, Network of the red module (module 9) showing a significant negative correlation to all assessed spike traits.

