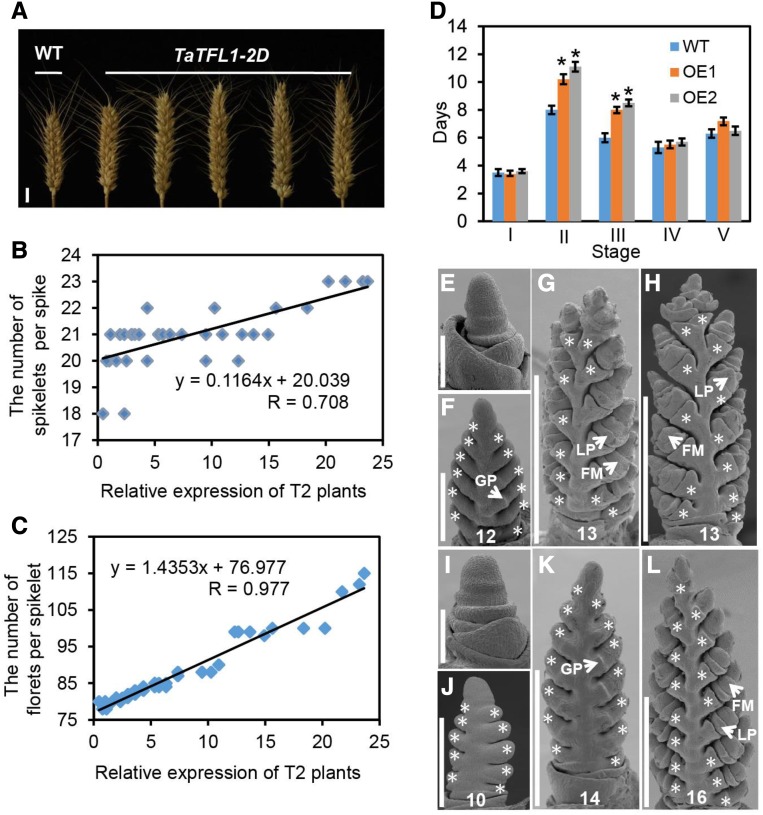
Figure 5.
Functional validation of TaTFL1-2D in the transgenic KN199 wheat line. A, Comparison of the spike complexity of KN199 and T2 transgenic TaTFL1-2D wheat plants. Scale bars, 1 cm. Positive correlation between spikelet number (B) and floret number (C) per main spike and TaTFL1 expression levels in T2 transgenic plants. D, Comparison of developmental duration between KN199 and T4 transgenic TaTFL1-2D lines (OE1 and OE2) at each stage. II, III, IV, and V indicate stage II, stage III, stage IV, and stage V, respectively. Data are the mean ± sd of 30 plants for each line. Student’s t test, *P < 0.05. Days, Days after a single ridge appearance; WT, wild type. E to H, Scanning electron micrographs of young spikes from KN199 plants at 3, 10, 15, and 21 d after a single ridge appearance. I to L, Scanning electron micrographs of young spikes from transgenic TaTFL1-2D plants at 3, 10, 15, and 21 d after a single ridge appearance. Scale bars, 200 μm (E and I), 300 μm (F and J), 500 μm (K), and 1 mm (G, H, and L). GP, glume primordium; LP, lemma primordium. The asterisks indicate spikelets. The number at the bottom represents the spikelet number per spike.

