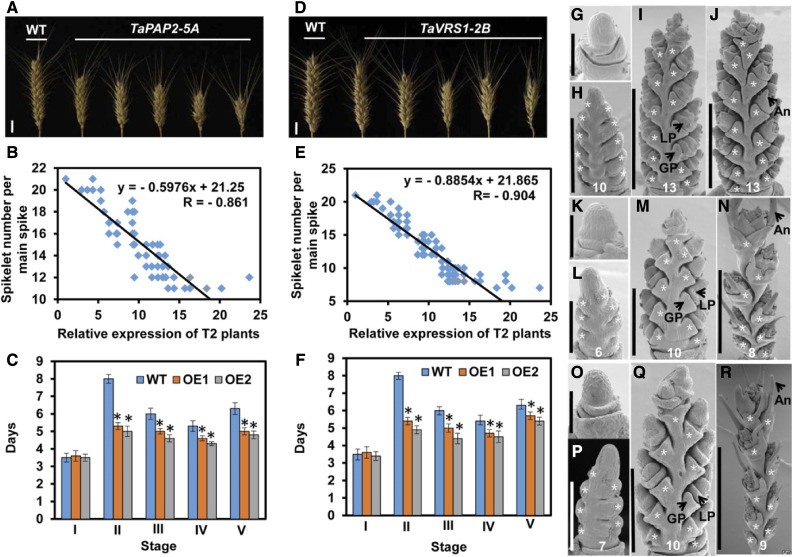
Figure 6.
Functional validation of TaPAP2-5A and TaVRS1-2B in the KN199 transgenic wheat line. Comparison of the spike complexity of KN199 plants with that of T2 transgenic TaPAP2-5A (A) and TaVRS1-2B (D) plants. Scale bars, 1 cm. Negative correlation between spikelet number per main spike and TaPAP2 (B) and TaVRS1-2B (E) expression levels in T2 transgenic plants. Comparison of developmental duration between KN199 plants and T4 transgenic TaTFL1-2D (C) and TaVRS1-2B (F) lines (OE1 and OE2) at each stage. I, II, III, IV, and V indicate stage I, stage II, stage III, stage IV, and stage V, respectively; WT, wild type. Data are the mean ± sd of 30 plants for each line. Days, Days after a single ridge appearance. G to J, Scanning electron micrographs of young spikes from KN199 plants at 2, 9, 15, and 22 d after a single ridge appearance. K to N, Scanning electron micrographs of young spikes from transgenic TaPAP2-5A plants at 2, 9, 15, and 22 d after a single ridge appearance. O to R, Scanning electron micrographs of young spikes from transgenic TaVRS1-2B plants at 2, 9, 15, and 22 d after a single ridge appearance. Scale bars, 200 μm (G, K, and O), 300 μm (H, L, and P), 500 μm (M and Q), 1 mm (I and J), and 3 mm (N and R). GP, glume primordium; LP, lemma primordium; An, awn. Student’s t test, *P < 0.05. The asterisks indicate spikelets. The number at the bottom represents the spikelet number per spike.

