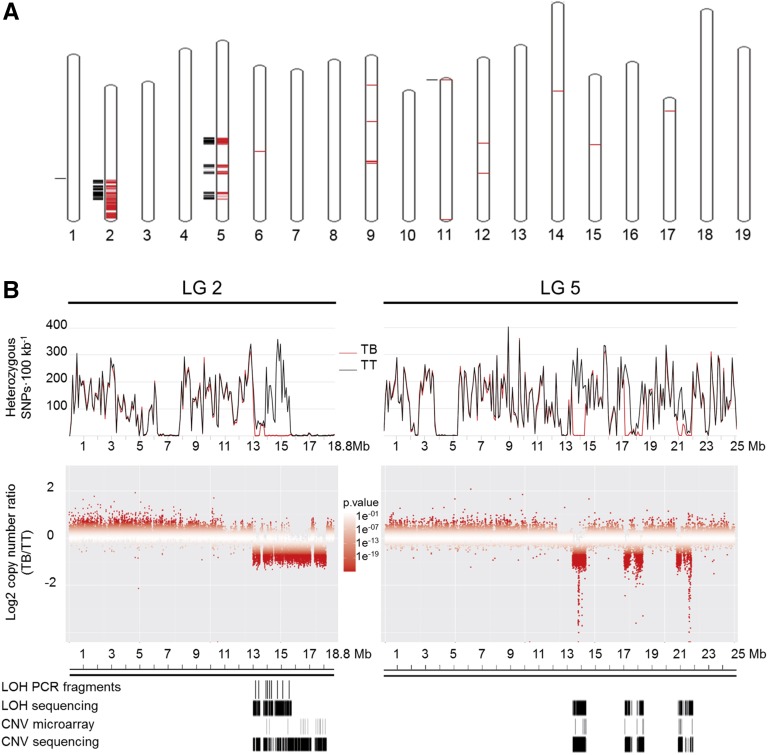
Figure 2.
Genome-wide scanning of LOH and copy number decrease in TB. A, Genome-wide representation of regions with significant LOH or copy number decreases in TB. Significant intervals were mapped to chromosomes of the PN40024 12X.0 reference genome using the V. vinifera whole-genome tool of EnsemblPlants (http://plants.ensembl.org/Vitis_vinifera/Location/Genome). Black outer lines show chromosome segments with significant LOH in TB. Red inner lines show chromosome segments with significantly decreased copy numbers in TB. B, Close-up of heterozygosity and CNV comparison between TT and TB resequencing data mapping on LGs 2 and 5. Top, Heterozygosity levels in TT (black traces) and TB (red traces). Middle, Copy number ratios between TB and TT. Windows are represented in increasing red color tones corresponding with CNV significance P values. Bottom, Comparison of LOH and CNV segments in TB detected by WGS and other approaches.

