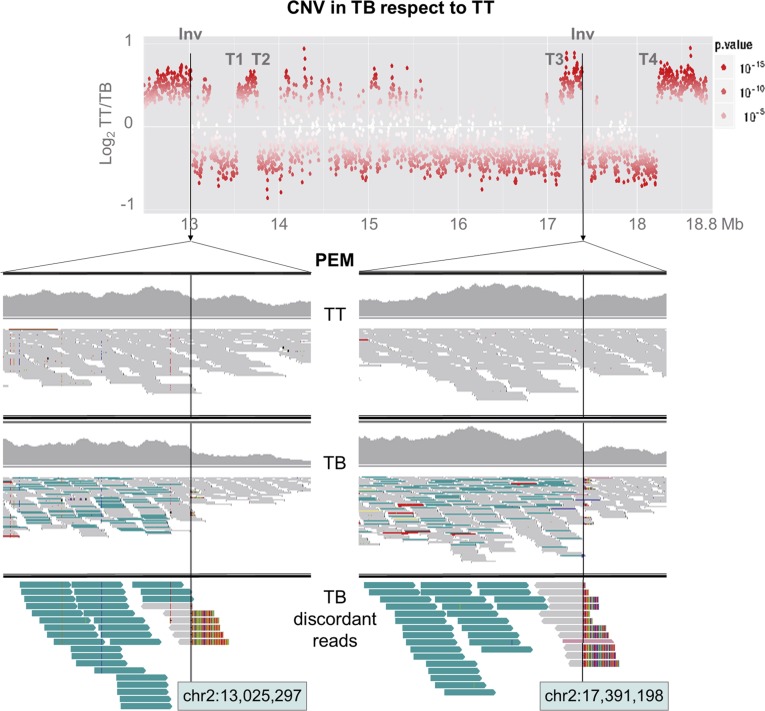
Figure 3.
Inversion breakpoints in TB LG 2. The graph at top shows a sharp decay in copy number at the 3′ flank of the two Inv breakpoints. The other graphs show reads aligned at both Inv breakpoint sites in TT and TB (images obtained from Integrative Genomics Viewer). All aligned reads are displayed in the IGV first (TT) and second (TB) upper windows, while only discordant reads from TB are displayed in the lower window. Reads are represented as arrows showing the orientation of paired-end mates. From the PEM analysis, read pairs with abnormally increased insert size are colored in turquoise and were detected only in TB. These read pairs are sense oriented, as expected in an inversion junction. Soft-clipped reads spanning the breakpoint show an unaligned extreme in colors.

