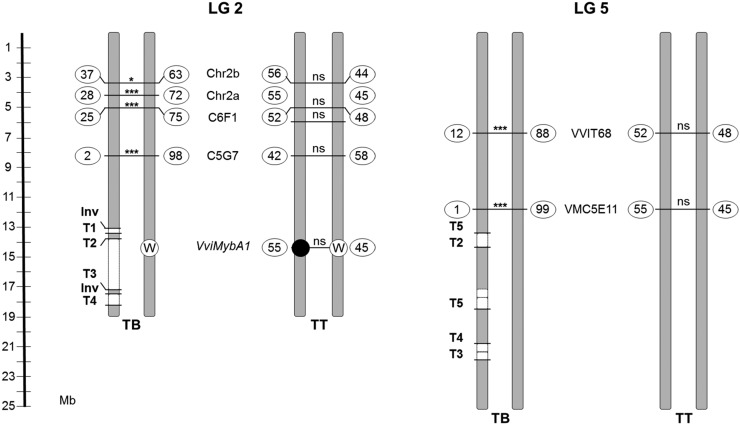
Figure 7.
Segregation of molecular markers at LGs 2 (left) and 5 (right) in TB and TT selfed progeny. Markers are mapped to the PN40024 reference genome chromosomes. Absolute frequencies (%) for each allele are shown inside circles, and the significance value of χ2 tests for the difference between the two allele frequencies is indicated for every marker (*, P < 0.05; ***, P < 0.0001; ns, not significant). White and black circles represent white and black berry color alleles in the VviMybA1 locus, respectively. Validated inversion (Inv) and translocation (T1–T5) breakpoints are depicted as well. Deleted chromosome segments detected by CNV analysis from WGS data are depicted as white boxes and linked in the same chromosome copy as determined by haplotype phasing using a TT self-cross progeny.

