Figure 7.
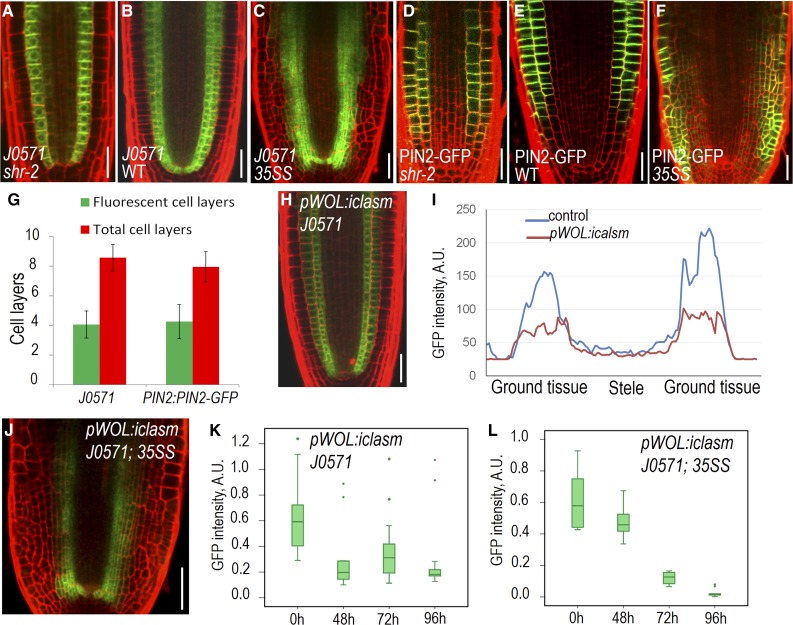
SHR integrates stele-derived signals to foster ground tissue identity. (A–C) Expression of J0571 in the root tip of shr-2, wild-type (WT) and 35S:SHR (35SS). D to F, Expression of pPIN2:PIN2-GFP in the root tip of shr-2, wild type, and 35SS. G, Quantification of fluorescent cell layers in 35SS roots expressing J0571 or pPIN2:PIN2-GFP. Data represented are mean ± sd of 16 ∼ 20 roots for each sample. H, Expression of J0571 with the activation of pWOL:icals3m in stele by the treatment of estradiol for 48 h (I) Comparison of J0571 fluorescent intensity in wild-type control (shown in B) and pWOL:icals3m-expressing roots (shown in H) after 48 h estradiol treatment. J, Expression of J0571 in the root expressing 35SS and pWOL:icals3m with 48 h estradiol treatment. K and L, Time course quantification of J0571 with activation of pWOL:icals3m in the root of the wild type (K) and 35SS (L). n = 24 to 25 roots. Sample minimum, lower bar; lower quartile, box; median, middle cross line; upper quartile, box; sample maximum, upper bar; green dot, excluded outliers data. The difference between the 0 h and other time points is significant (P = 0.00052 for 48 h, 0.01374 for 72 h, and 0.00203 for 96 h in K; P = 0.00176 for 48 h, 1.0922E-11 for 72 h, and 1.97324E-13 for 96 h in L). Scale bars = 20 μm.

