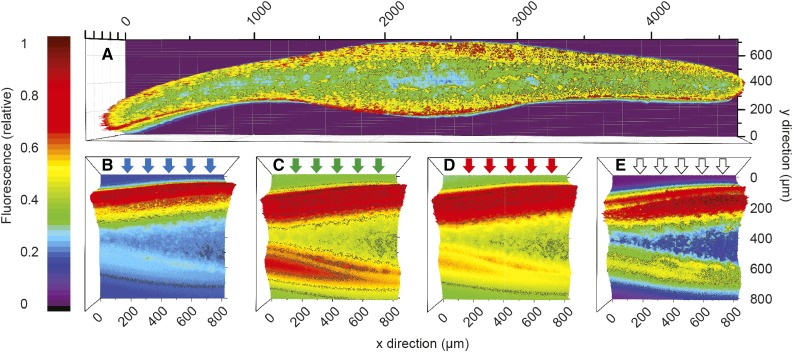
Figure 2.
Color-coded maps showing the distribution of chlorophyll a fluorescence (normalized to maximum fluorescence) of an F. vesiculosus thallus cross section illuminated evenly over the cut side with 430-nm light from a xenon lamp (the plot is composed of multiple images taken through a 10× objective and stitched together using Adobe Photoshop; A) and thallus cross sections illuminated perpendicular to one side of the thallus surface with a supercontinuum laser sheet of different spectral compositions of blue light (425–475 nm; B), green light (525–575 nm; C), red light (615–665 nm; D), and white light (400–700 nm; E).

