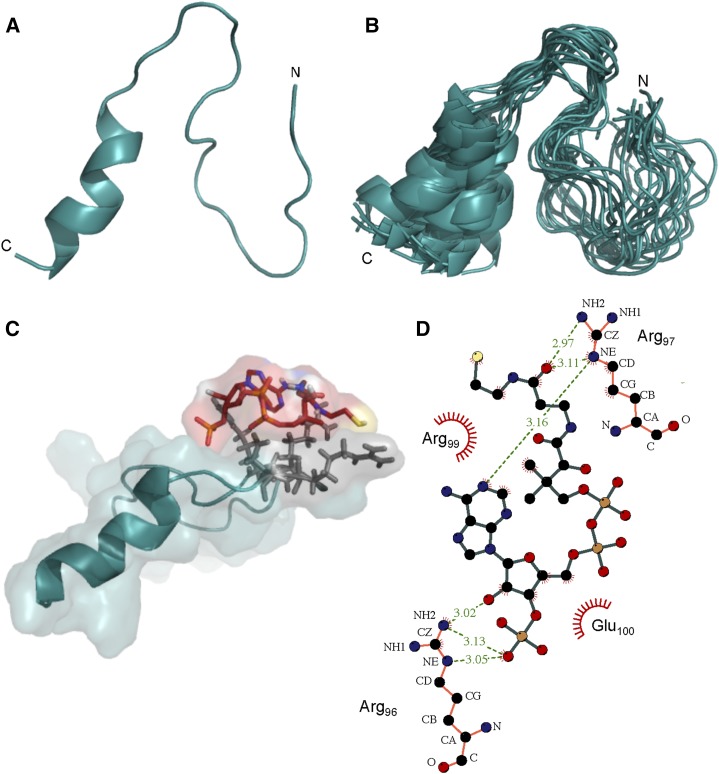
Figure 5.
3D structure of the allosteric site in the BnaDGAT1 N-terminal domain and binding studies with CoA. A, NMR solution structure of BnaDGAT181-113 in 30 mm sodium phosphate buffer (pH 6.3) and 25 mm NaCl exhibiting an α-helix at the C terminus. B, Overlay of the 20 lowest energy conformers. C, Docking of the allosteric site with CoA using AutoDock Vina (Trott and Olson, 2010). The interacting residues were identified using NMR titration experiments (Supplemental Fig. S5). D, Layout of interacting residues obtained using LigPlot software (Wallace et al., 1995). Hydrogen bonds are shown by green dashed lines, while hydrophobic interactions are shown by red rays arranged in a circular fashion.

