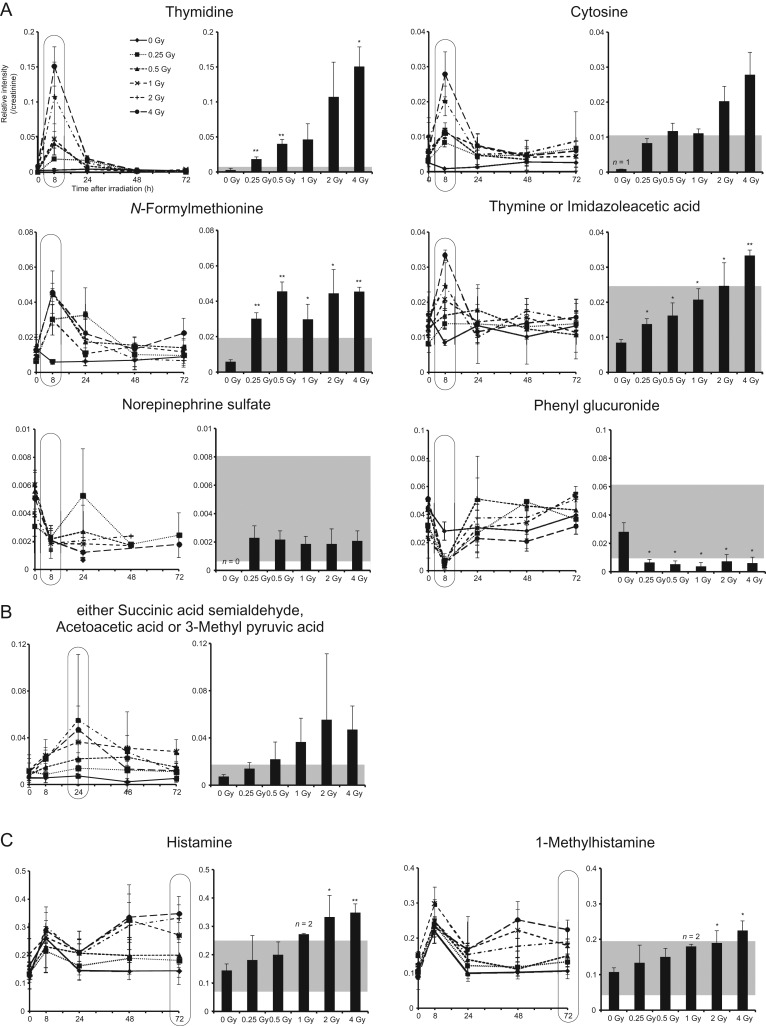
Fig. 3.
Urinary excretion of the candidate metabolites. (Left) Relative intensity shown as the ratio of intensity of (A) thymidine, cytosine, N-formylmethionine, thymine or imidazoleacetic acid, norepinephrine sulfate and phenyl glucuronide, (B) either succinic acid semialdehyde, acetoacetic acid or 3-methyl pyruvic acid and (C) histamine and 1-methylhistamine, to that of creatinine. (Right) Dose-dependent changes were observed. The time point selected is indicated with circles in the corresponding left panel. The results are presented as mean ± SD. **P < 0.01, *P < 0.05, compared with sham-irradiated samples. Shaded portion shows mean ± 2 SD of each measurement of all sham-irradiated and unirradiated (0 h time point) mice urine. Due to the limit of the measurements and the number of mice available (n = 5), some dose/time points were missed, or are represented by one single, or the average of two, intensity values.

