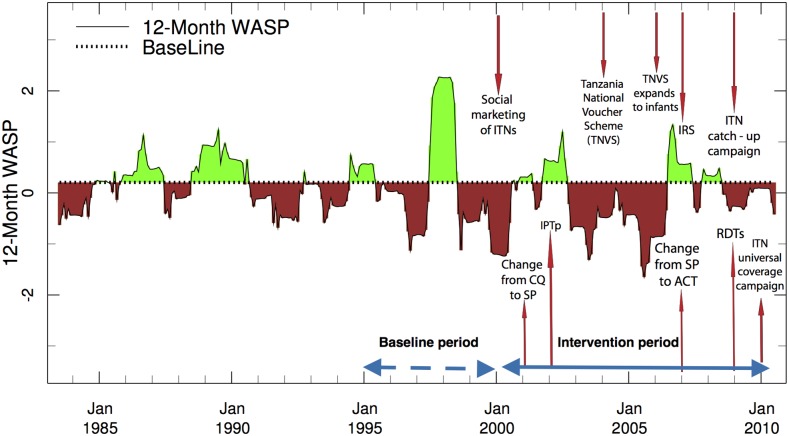
Figure 3.
Tanzania ENACTS Weighted Anomaly Standardized Precipitation (WASP) Index using Enhanced National Climate Services products blended station and satellite data for Tanzania using a baseline period January 1995 to December 1999. Brown indicates time where rainfall was below the baseline average, whereas green indicates rainfall was above the baseline average. The WASP analysis is overlaid with the timing of interventions described in detail in Smithson and others (2015).

