. 2017 Sep 13;6:e29257. doi: 10.7554/eLife.29257

Figure 5. BAM-2 interacts with CASY-1.

(A) Distribution of a mCherry-tagged presynaptic marker RAB-3 in HOA axon of wild type or bam-2(cy6) mutants. Arrowheads indicate gaps between the presynaptic puncta. (B) Number of mCherry::RAB-3 puncta in bam-2 mutants was counted and compared to wild type (n = 30). Error bars are SEM. (C) Images of axon placement of HOA, AVG and PHC in bam-2 and casy-1;bam-2 double mutants. Axon fasciculation between each neuronal pair in the dashed box region and schematic of axon fasciculation are shown on the right. Arrowheads indicate the region where two axons are detached from each other. (D) Percentage of axon-axon contact between each neuronal pair in wild type or mutant animals (n = 40). Each dot represents individual animal. Red bar represents the median. (E) Percentage of axon-axon contact between each neuronal pair in animals expressing a full-length bam-2 cDNA in HOA or PHC in bam-2 mutant background (n = 30). In (C–E), the data for wild type and casy-1 mutants are the same as shown in Figure 2. (F) Co-immunoprecipitation of CASY-1 and BAM-2. Scale bars, 20 μm. **p<0.01; ***p<0.001; ns, not significant (by Mann-Whitney test). For the data and statistics, see Figure 5—source data 1.

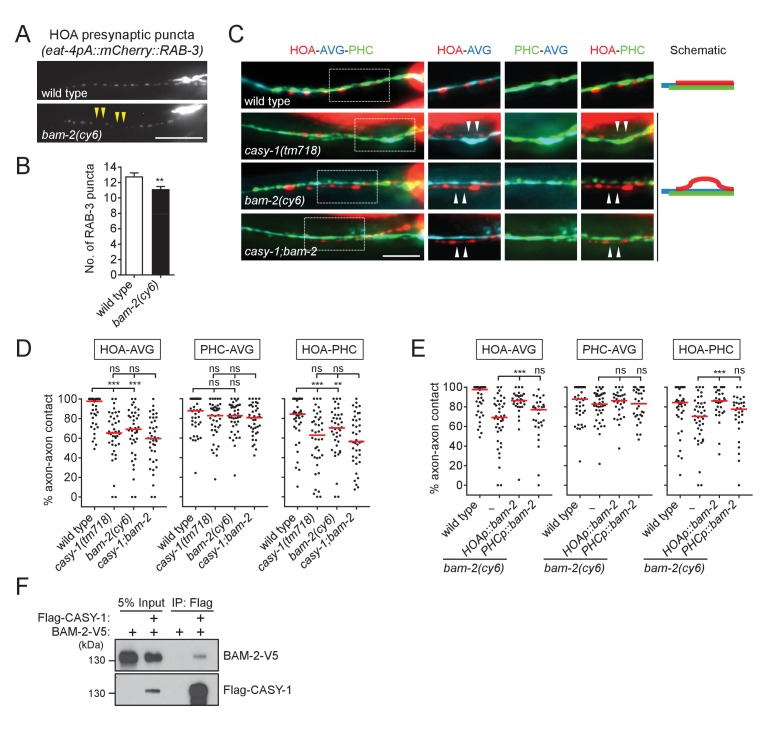
Figure 5—source data 1. Source data for Figure 5, Figure 5—figure supplement 1, and Figure 5—figure supplement 2.
DOI: 10.7554/eLife.29257.018

Figure 5.

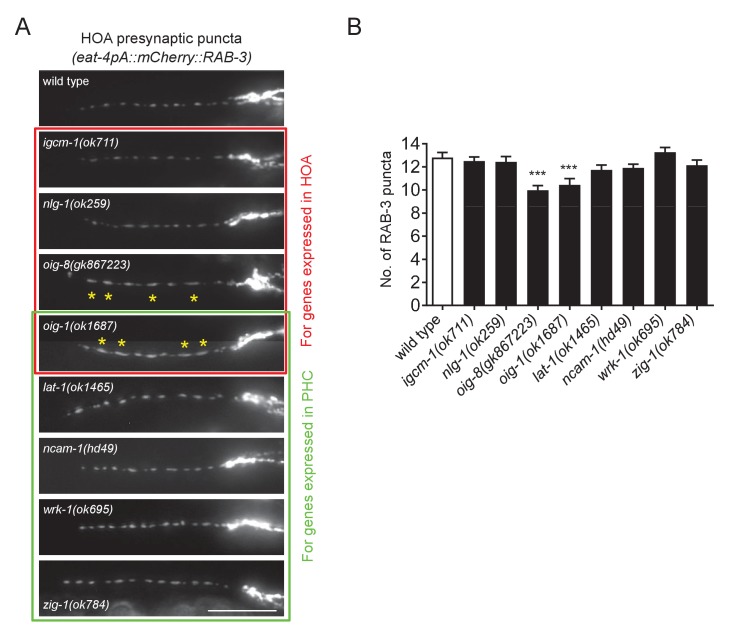
Figure 5—figure supplement 1. HOA presynaptic puncta phenotypes of mutants for cell adhesion genes.

Figure 5—figure supplement 1.

(A) Distribution of a mCherry-tagged presynaptic marker RAB-3 in HOA axon of mutants for cell adhesion genes expressed in HOA (red box) or PHC (green box). Expression pattern of these genes is shown in Figure 1E. Asterisks indicate diffused puncta. Scale bar, 20 μm. (B) Number of mCherry::RAB-3 puncta in mutants was counted and compared to wild type (n = 30). Error bars are SEM. ***p<0.001 (by Mann-Whitney test). In oig-1 and oig-8 mutants, the puncta numbers were decreased due to the diffused puncta, of which cause is still elusive. For the data and statistics, see Figure 5—source data 1. The data for wild type are the same as shown in Figure 5.
Figure 5—figure supplement 2. NRX-1 does not interact with CASY-1.

Figure 5—figure supplement 2.

(A) Distribution of a mCherry-tagged presynaptic marker RAB-3 in HOA axon of a hypomorphic nrx-1(ok1649) and a null nrx-1(wy778) mutants. Scale bar, 20 μm. (B) Number of mCherry::RAB-3 puncta in mutants was counted and compared to wild type (n = 30). Error bars are SEM. ns, not significant (by Mann-Whitney test). For the data and statistics, see Figure 5—source data 1. (C) Co-immunoprecipitation assay for CASY-1 and NRX-1. The data for wild type are the same as shown in Figure 5.