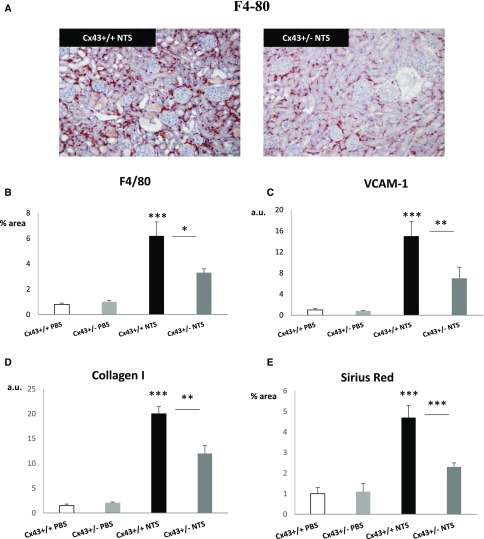
Figure 3.
Cx43+/− mice develop less renal inflammation and fibrosis. (A and B) Immunohistochemistry for F4/80 and (C) quantitative PCR for VCAM-1 at day 15 indicate that Cx43+/− mice develop less inflammation compared with wild-type mice. At the same time point, (D) quantitative PCR for collagen I and (E) quantification of Sirius red staining show restriction of the fibrotic response in Cx43+/−mice. Quantitative PCR data are expressed in graphs as arbitrary units (a.u.) that represent the ratio of the target gene to internal control gene (HPRT). *P<0.05; **P<0.01; ***P<0.001.

