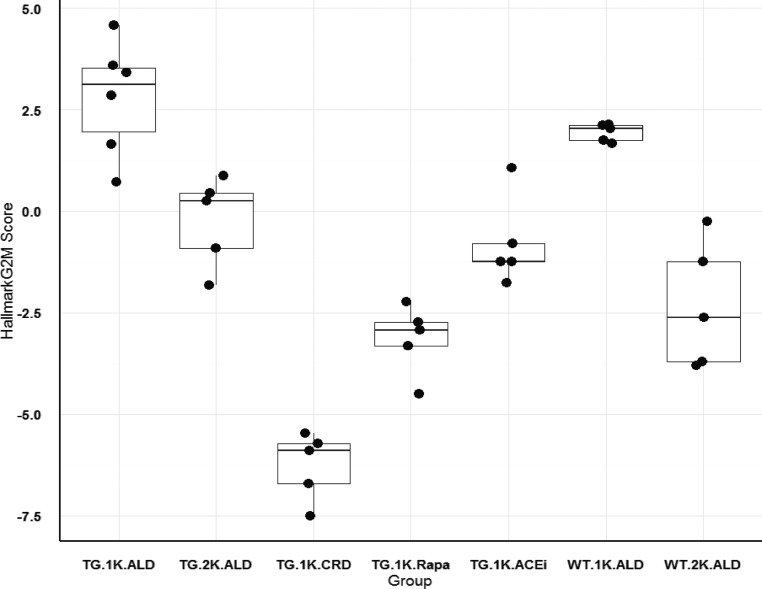
Figure 7.
Glomerular transcriptional HALLMARK_G2M_CHECKPOINT cell cycle signature for rat groups. Each rat glomerular Affymetrix transcriptome was used to obtain a G2M signature value derived from the “Hallmark_G2M” gene list downloaded from the GSEA/MSigDB molecular signatures database at the Broad Institute (see Concise Methods). Data were normalized as shown on the y axis. Individual points for each rat are shown according to groupings defined according to whether they were TG or WT, nephrectomized (1K) or sham-nephrectomized (2K), and whether they were maintained on an ad libitum diet (ALD) or a calorie intake reduction diet (CRD). Data for groups are shown as box plots with a mean and interquartile range. The rat group that developed FSGS lesions (TG.1K.ALD) was significantly different from all groups (P<0.01) except the WT.1K.ALD group. TG rat groups that were prevented from developing FSGS in spite of undergoing nephrectomy (TG.1K.ALD, TG.1K.ALD.Rapa, and TG.1K.ALD.ACEi) had significantly lower G2M values. Note that 98% of glomeruli purified by sieving for Affymetrix analysis do not include Bowman’s capsule and therefore PECs are not represented. The group distribution is similar to the Ki67 data shown in Table 3. Rapa, rapamycin.

