Figure 5. Long-term stability of single unit activity.
(A) Histograms of average firing rates for units recorded in DLS (left) and MC (right). Putative cell-types, medium spiny neurons (MSN, blue) and fast-spiking interneurons (FSI, green) in DLS, and regular spiking (RS, brown) and fast spiking (FS, red) neurons in the MC, were classified based on spike shape and firing rate (Materials and methods). The continuous traces are log-normal fits to the firing rate distributions of each putative cell-type. Insets show average peak-normalized waveform shapes for MSNs (left-bottom) and FSIs (left-top), and RS (right-bottom) and FS (right-top) neurons. Shading represents the standard deviation of the spike waveforms. (B) Firing rates of DLS (left) and MC (right) units over 20 days of recording. The color scale indicates firing rate on a log-scale, calculated in one-hour blocks. Units have been sorted by average firing rate. (C) Scatter plots of unit firing rates over time-lags of 1 (left), 5 (middle) and 10 (right) days for DLS (top) and MC (bottom). The dashed lines indicate equality. Every dot is a comparison of a unit’s firing from a baseline day to 1, 5 or 10 days later. The color of the dot indicates putative cell-type as per (A). Each unit may contribute multiple data points, depending on the length of the recording. Day 1: n = 4398 comparisons for striatum and n = 1458 for cortex; Day 5: n = 2471 comparisons for striatum and n = 615 for cortex; Day 10: n = 1347 comparisons for striatum and n = 268 for cortex. (D) Stability of unit firing rates over time. The firing rate similarity (see Materials and methods) was measured across time-lags of 1 to 20 days for the same unit (within-unit, solid lines), or between simultaneously recorded units (across-unit, dashed lines) in DLS (left) and MC (right). Colored shaded regions indicate the standard deviation of within-unit firing rate similarity, over all units. Grey shaded regions indicate standard deviation of across-unit firing rate similarity, over all time-bins. (E) Inter-spike interval (ISI) histograms for example units in DLS (left, green) and MC (right, orange) over two weeks of continuous recordings. Each line represents the normalized ISI histogram measured on a particular day. (F) Stability of unit ISI distributions over time. Correlations between ISI distributions were measured across time-lags of 1 to 20 days for the same unit (within-unit, solid lines), or between simultaneously recorded units (across-unit, dashed lines) in DLS (left) and MC (right). Colored shaded regions indicate the standard deviation of within-unit ISI similarity, over all units. Grey shaded regions indicate standard deviation of across-unit ISI similarity, over all time-bins.

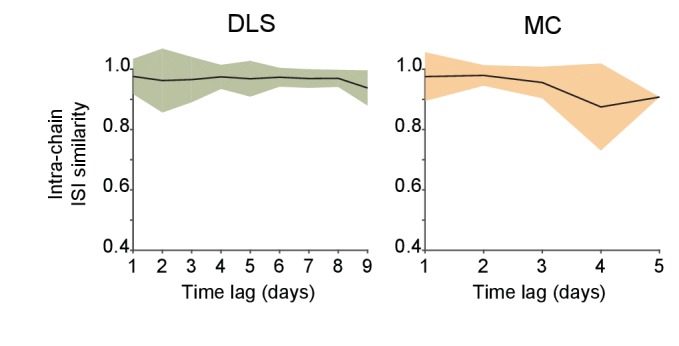
Figure 5—figure supplement 1. Stability over time of ISI distributions computed from spike chains that were automatically identified by FAST.