
Fig. 14.
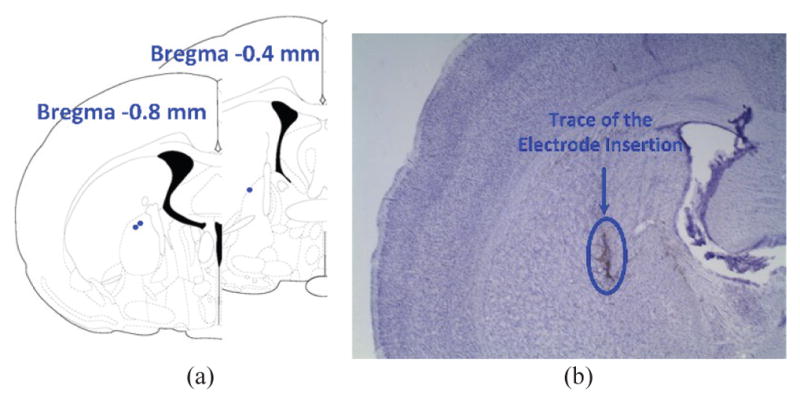
Electrode placement and Histology. (a) The red dots represent placement of the tip of the electrodes, all in the GPi. (b) Sample brain slice, stained with Nissl staining. The dark track in the center of the picture is the trace of the electrode insertion in the brain.