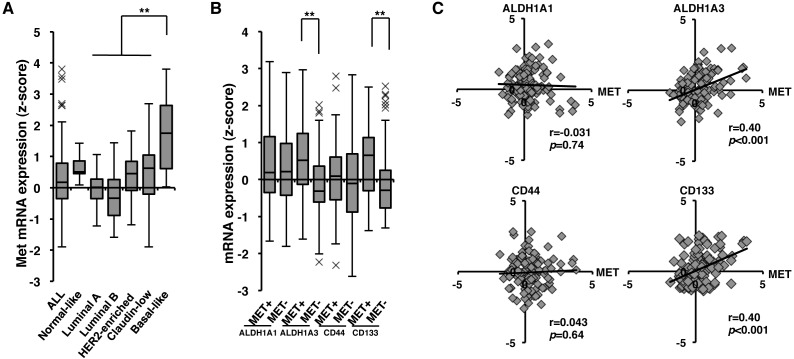
Figure 2. Correlation of c-Met with ALDH1A3 and CD133 at gene expression level in tumor stage III and IV of breast cancer.
A. c-Met expression levels in breast cancer subtypes of tumor stage III-IV. Values are shown as box-and-whisker plot (Tukey's test, **p < 0.01). B. Gene expression levels of ALDH1A1, ALDH1A3, CD44, and CD133 with high (c-Met+) and low (c-Met -) c-Met expression at tumor stage III-IV. Values are shown as box-and-whisker plot (Tukey's test, **p < 0.01). C. Correlation of c-Met with ALDH1A1, ALDH1A3, CD44, and CD133 at tumor stage III-IV. Values are shown as scattered plots. The coefficient of correlation (r) and the p value (p) are indicated.

