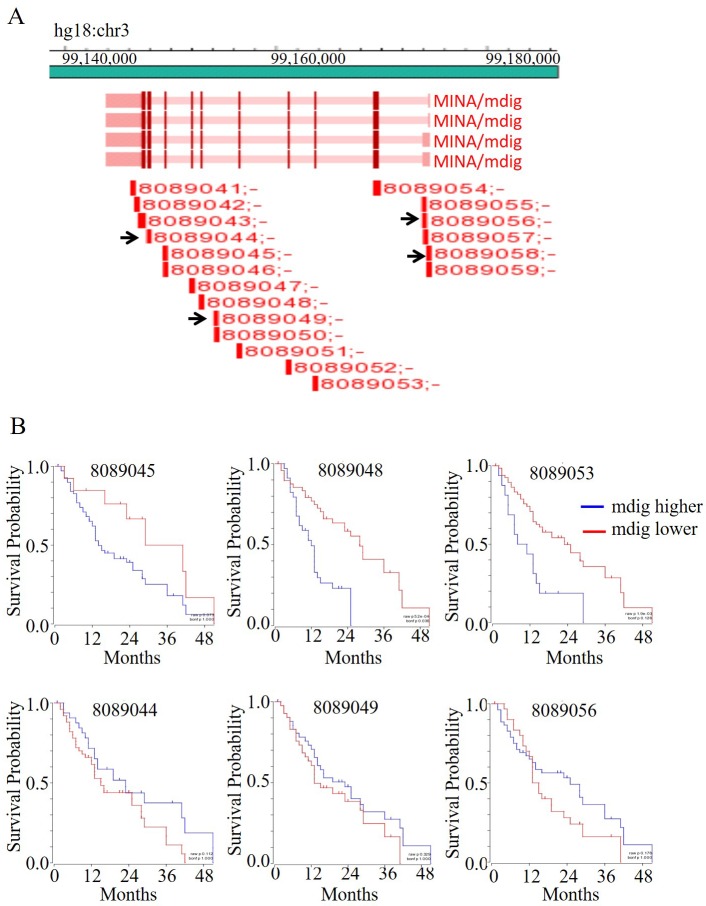
Figure 5. The levels of mdig expression predict survival of the patients with pancreatic cancer.
A. Diagram of mdig gene structure and the positions of the probe detected. B. Kaplan-Meier survival analysis of the selected probe sets as indicated in the R2: Genomics Analysis and Visualization Platform database. Y axis depicts survival probability and X axis depicts months.

