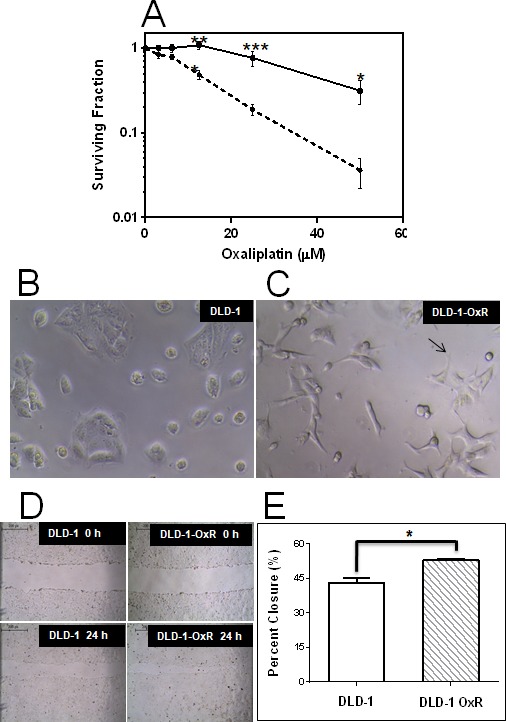
Figure 1. DLD-1-OxR exhibited resistance to oxaliplatin, mesenchymal cell morphology and increased cell migration compared to parental cells.

A. The effect of oxaliplatin on DLD-1 (dashed line) and DLD-1-OxR (solid line) by clonogenic assay. Both DLD-1 and DLD-1-OxR cells were exposed to varying concentrations of oxaliplatin, and surviving colonies were counted. Each data point represents the mean of four independent experiments and three replicates per experiment. Means ± SEM were displayed. * = P < 0.05, ** = P < 0.01, *** = P < 0.001. n = 4. . Plating efficiency (PE) was calculated as the ratio of the number of colonies formed to the number of cells seeded without treatment. B. and C. Oxaliplatin-resistant DLD-1-OxR cells exhibited typical mesenchymal phenotype (10x magnification). Cell clusters were evident in parental DLD-1 cells B. and absent in DLD-1-OxR cells C. Loss of cell clustering was due to loss of cell-cell adhesion by oxaliplatin-resistant cells. Oxaliplatin-resistant cells were spindle-shaped and had pseudopodia (note arrow in C). These morphological changes are consistent with a mesenchymal phenotype. D. and E. Oxaliplatin-resistant DLD-1-OxR cells exhibited increased cell migration in a wound healing (closure) assay (10x magnification). D. Representative images of wound assay results at 0 and 24 hours after scratch. E. Percent closure results for DLD-1 and DLD-1-OxR. Means ± SEM results were displayed. * = P < 0.05. n = 3.
