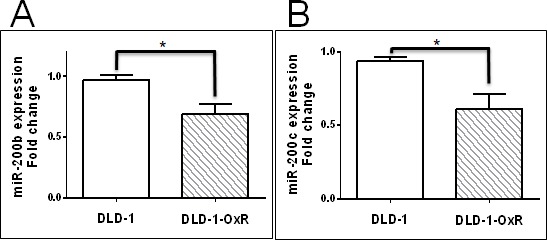
Figure 3. Expression of miR-200b and miR-200c in DLD-1 and DLD-1-OxR cells were decreased compared to DLD-1 parental cells.

Expression levels of miR-200b A. and miR-200c B. in DLD-1 and DLD-1-OxR were analyzed by quantitative reverse transcription PCR. Both miR-200b and miR-200c expression levels were decreased in DLD-1-OxR compared to DLD-1. Means ± SEM were displayed. * = p < 0.05. n = 5.
