Fig. 7.

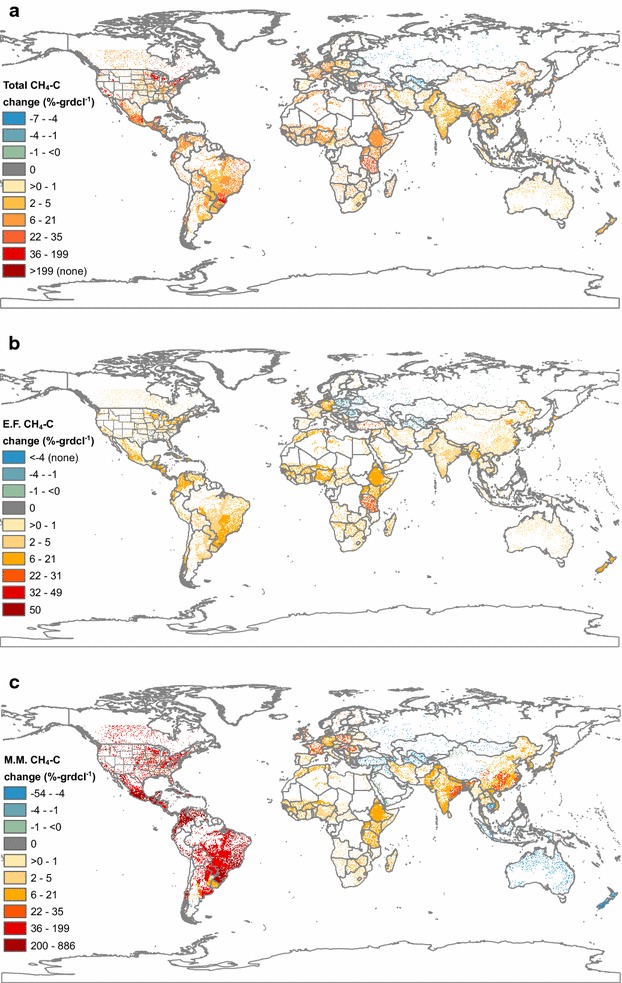
Percent change in global livestock methane emissions with revision, downscaled to 0.05 × 0.05° resolution, for the total (a), enteric fermentation (E.F.) (b), and manure management methane (M.M.) emissions (c), in 2011

Percent change in global livestock methane emissions with revision, downscaled to 0.05 × 0.05° resolution, for the total (a), enteric fermentation (E.F.) (b), and manure management methane (M.M.) emissions (c), in 2011